If we take a look at the bigger picture on the Gold Futures contract, you can see that the Gold bull run started from the major low in July 1999. It spent 146 months in a bull market, where it topped in September 2011. If we apply a Range Resistance Card on these two levels, you can see that the market has been able to retrace 50% – a place that Gann suggested is an important level to watch.
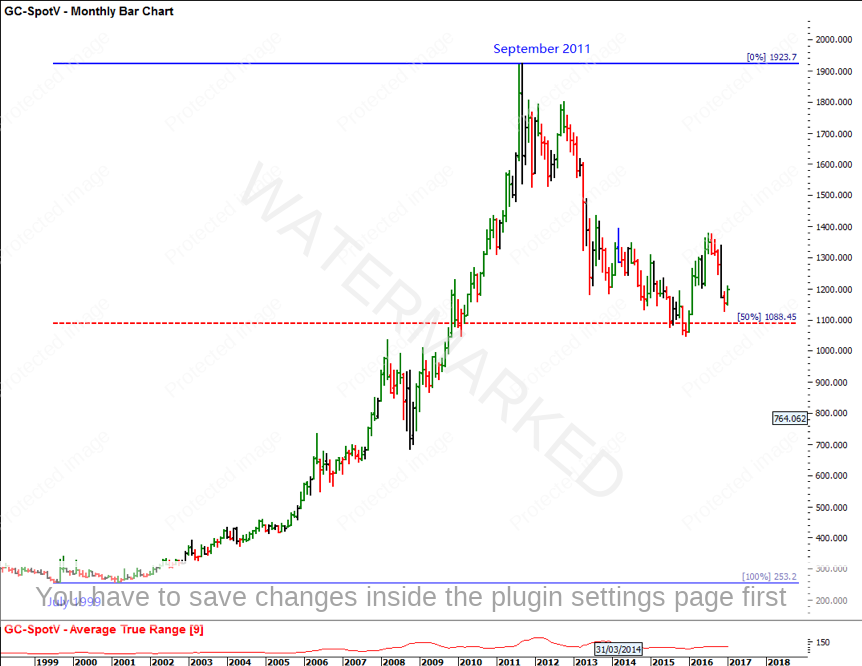
If we break down the decline from 2011 to 2016, you will note that the first range out (FRO) on the monthly chart was from the top at $1,923.7 in September 2011 to a low at $1,535 in September 2011. This was clearly an overbalance of price on the bigger picture. While the overbalance occurred, the market seemed to stay in a range from September 2011 to October 2012, creating both a triple bottom and triple top. If however, we project the FRO from off the final top in October 2012, the market made a very sharp move all the way to 150%, an important pressure point David Bowden shows us on the Road Map Chart. David also suggested to watch for 200% of a run from a Double Top or Double Bottom. In this case, we can also project the triple top as a target at 200%, which looks to cluster with the FRO.
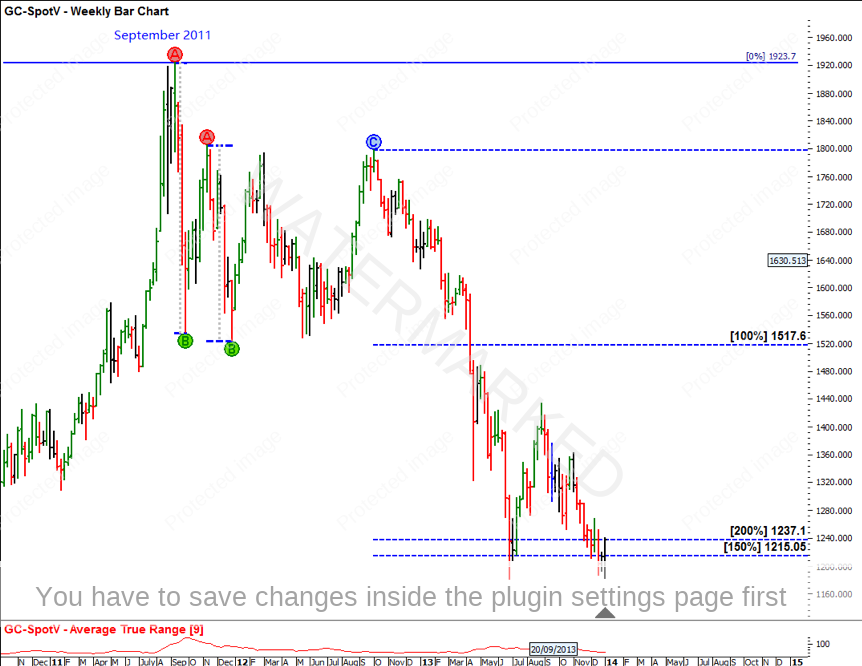
By using the FRO again, we can project it down from the August 2013 top. The projected target was $1,045.3 and the market bottomed at $1,045.4. The bigger picture 50% at $1,088.45 failed to hold, however, the market was able to accumulate between these two levels before it shot up.

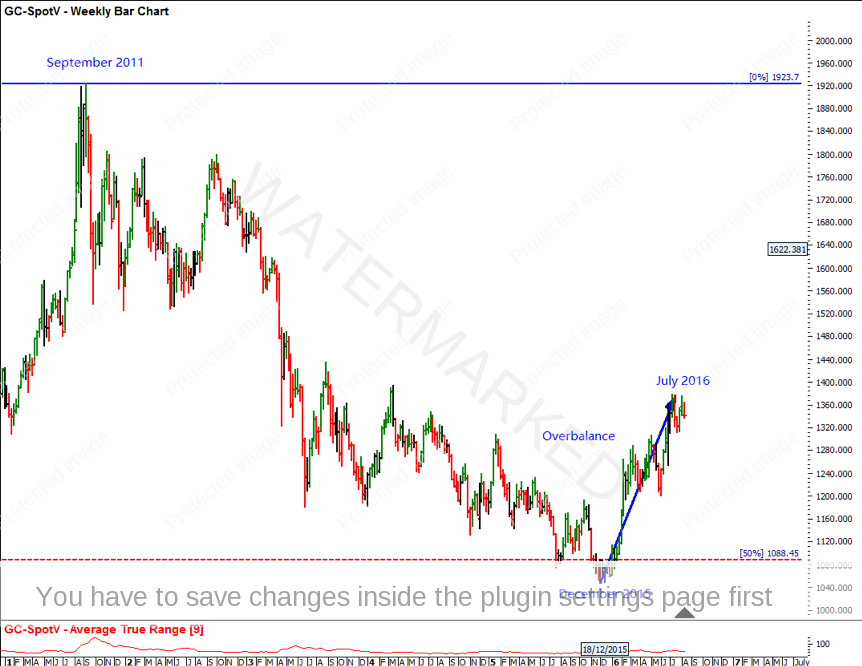
The most recent market action from the low in December 2015 to the July 2016 high has produced an overbalance in price and time compared to all previous reactions since the September 2011 top was made.
At the time you would have noticed that there was a quarterly higher Swing bottom confirmed. The previous quarterly swing down was 262.4 points and the market retraced 253.2 points whilst being able hold above the bigger picture 50% level at $1,088.45. This shows signs of strength in the December 2015 bottom. It is also interesting to note that on the weekly chart if we project the FRO of the pullback the market repeats 150%, which as we discussed earlier is an important place to watch on the Road Map Chart.
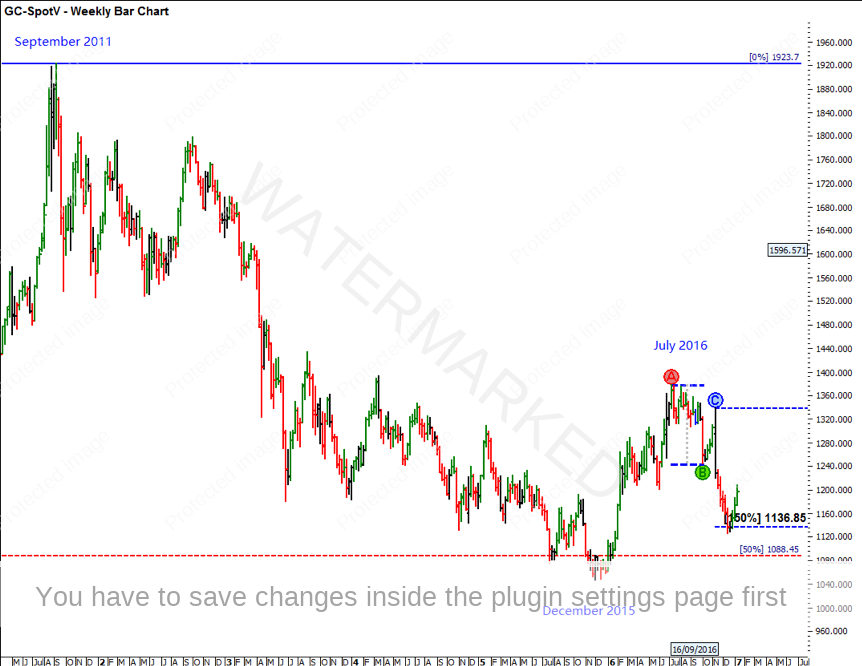
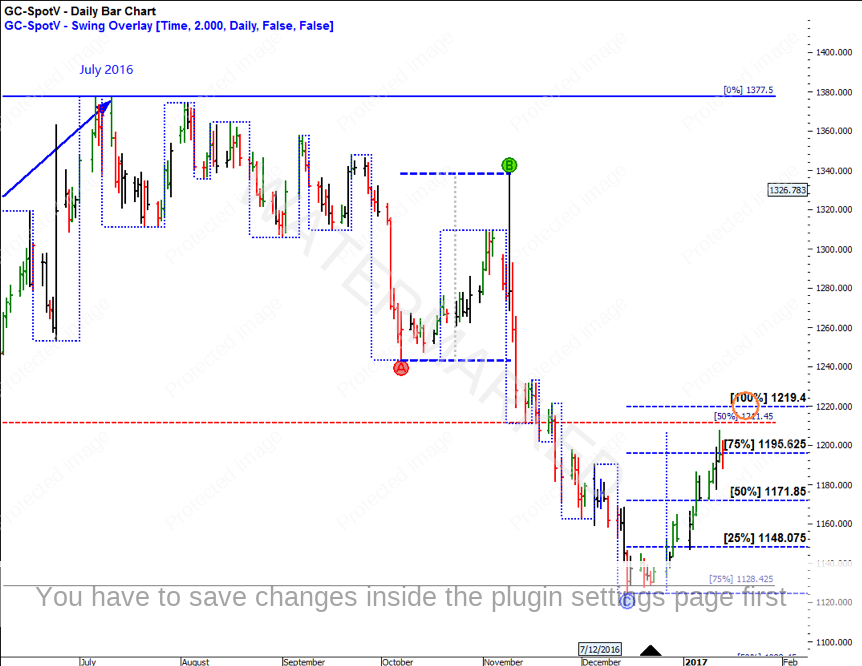
So, if you were ready for a new bull market section, a 75% retracement is a good place to watch the market bottom before it pushes for a new bigger picture section. If we zoom into the daily chart (and you were ready and waiting), you could have caught the first higher swing bottom on the daily chart which had a very small risk of about 12 points. However, if this strategy is too aggressive for some, then there is no harm in waiting for further confirmation using say a 2-day or 3-day chart which provided a much more appealing picture.

Let’s take a look at trading this move using a futures contract. Refer to Gold future specs below:
[table id=1 /][table id=2 /]
You could look to use the previous price reaction reference range from 7 October 2016 to 9 November 2016. The 100% price target sits at $1,219.4. At the time you would have seen an overbalance of price on the 2 day swing chart of over more than two times. I was watching the 50% level at $1,211.4 (which is the 50% level of December 2015 – July 2016 Range Resistance Card), and also the 100% price target at $1,219.4. I was waiting to see a break of the $1,219.4 level in more than 33 days to confirm that there is an overbalance in price and time on the bigger picture. The market was able to reach $1,220.1 before it had a minor pullback.
At the time, the market was yet to produce more than a two-day pullback so in David’s books that was a strong move. A two-day pullback would confirm the retracement, and confirm the new potential FRO.
It’s Your Perception
Robert Steer