150% – Possible Point A
The Active Trader Program comes with the ‘Milestone Chart’ which seems oversimplified on first impressions, but has definitely stood the test of time. In fact, it is fundamental to the Safety in the Market trading system. The ABC Pressure Point Tool in ProfitSource is simple and effective, especially when applied on a number of time frames.
As much as we can rely on form reading to identify ‘signs of completion’ like signal tops and bottoms and false breaks, arguably it’s our different milestones that provide the most significant areas to watch.
This month I look at the very recent double bottoms on the SPI200, the milestones at play, and whether there is a potential for a 10 to 1 or higher Reward to Risk Ratio trade.
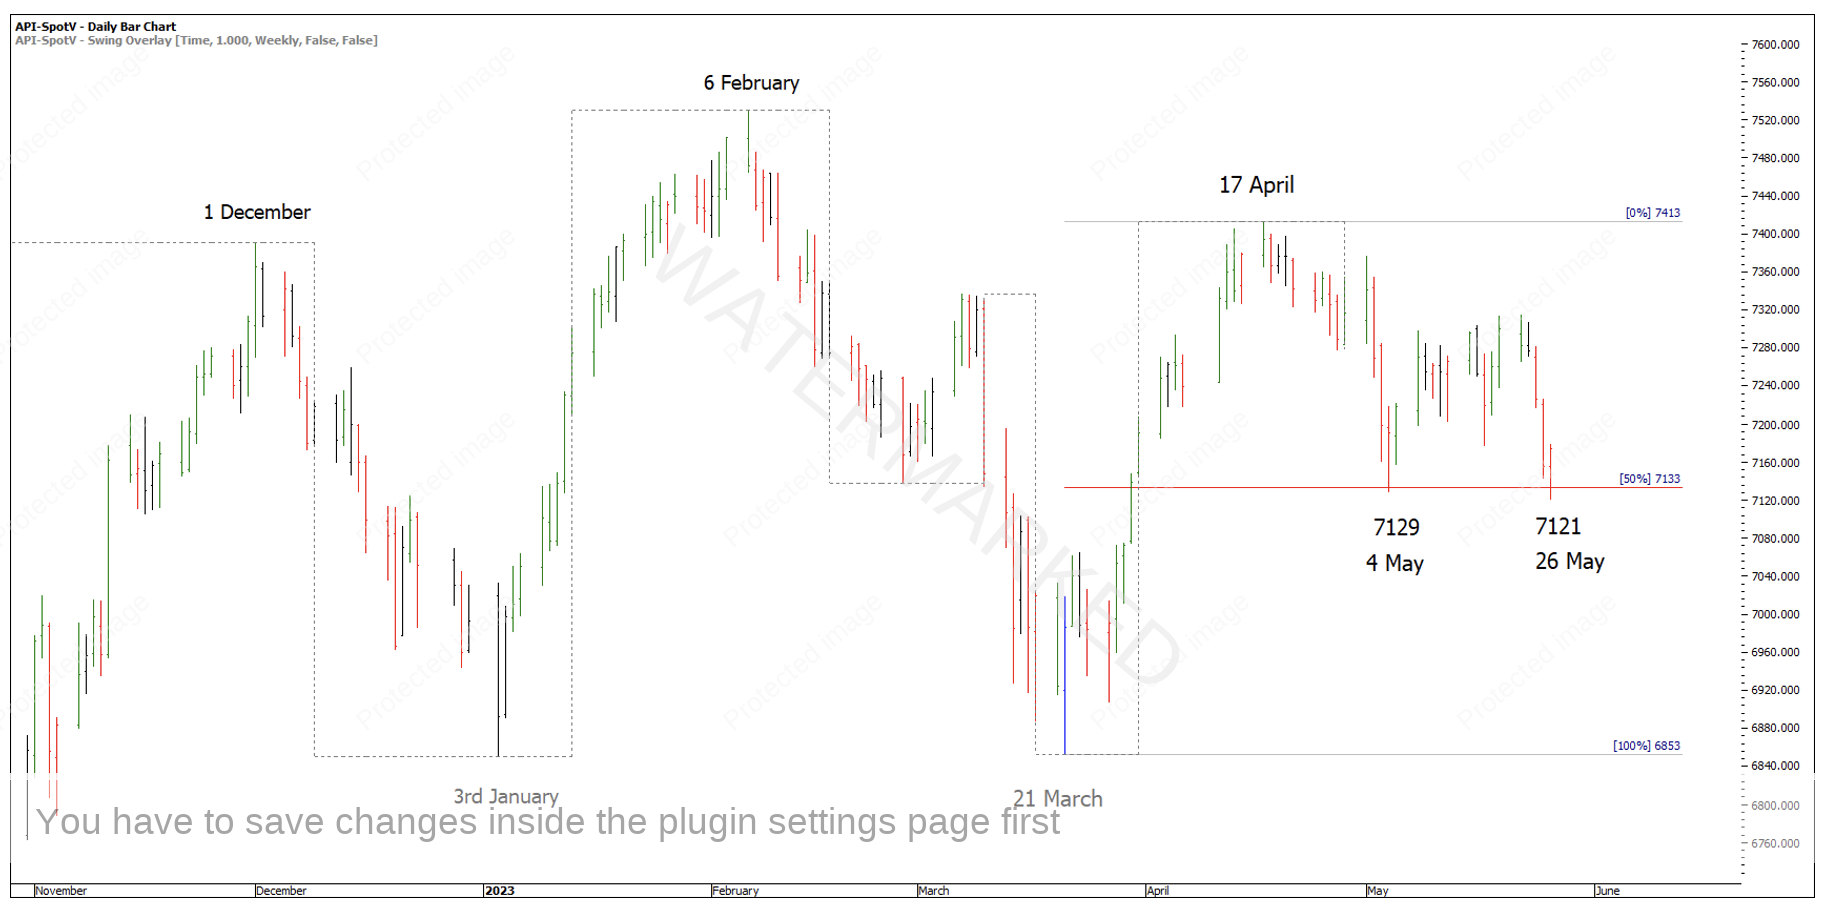
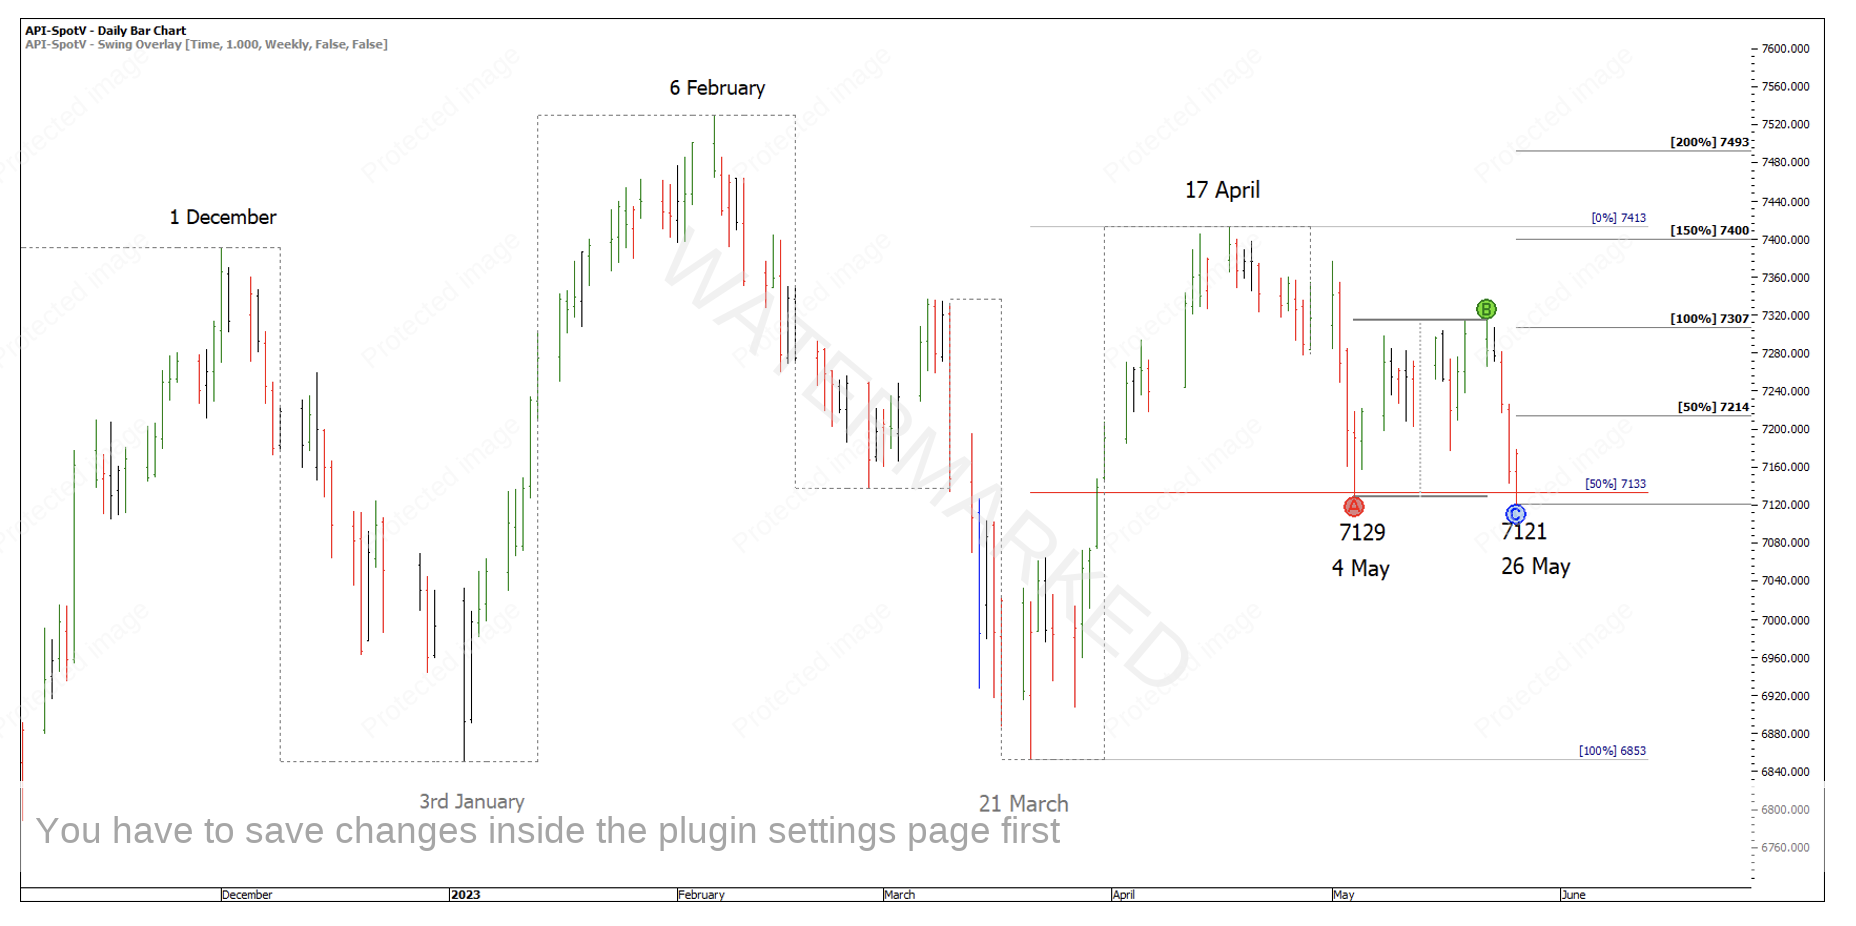
The 4 May low was broken by 8 points on 26 May with a low at 7121. As you can see in Chart 1 below, the double bottoms have come in on a 50% retracement of the weekly swing range up.
Chart 1 – Double Bottoms
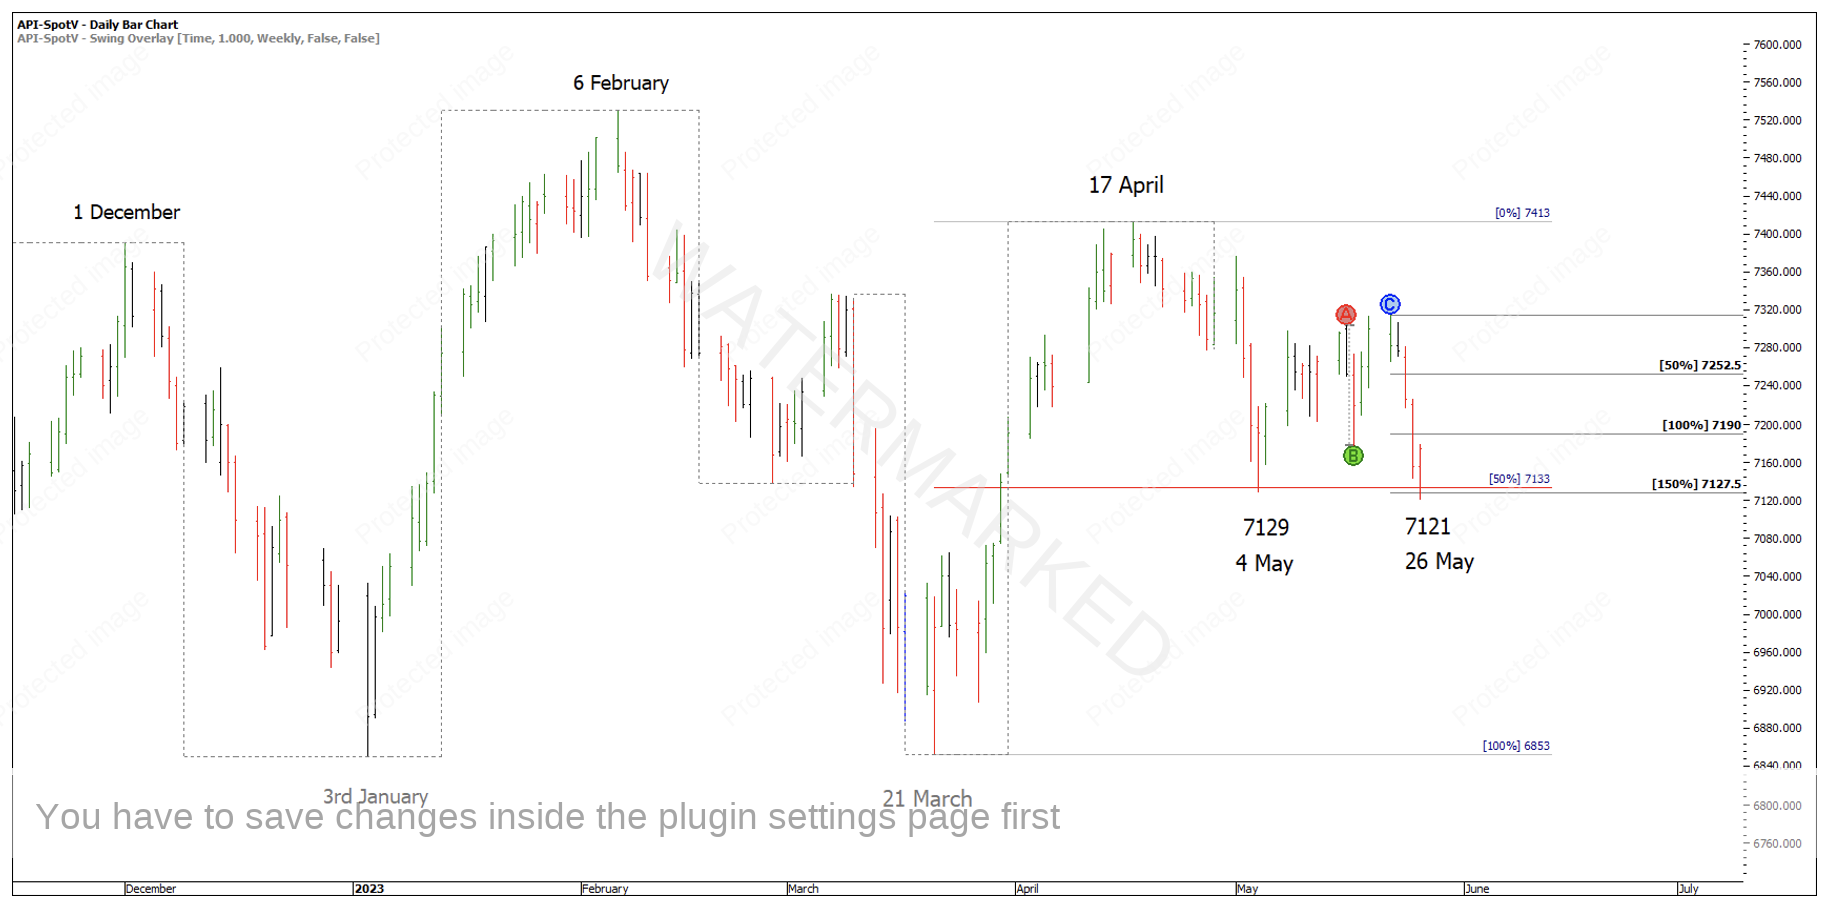
As far as the swing milestones are concerned, there was a daily swing milestone at 150% which David Bowden called a “Possible Point A”.
Chart 2 – 150% Daily Swing Milestone
So far, the three parts to this cluster are:
- 50% retracement = 7133
- False break double bottom = 7129
- 150% of the last daily swing = 7127.5
A great benefit of a false break double bottom setup like this is the opportunity for a smaller risk entry and therefore a larger reward, which makes a 10 to 1 a very reasonable target. Secondly, it also means that you can move your stop loss to a break even or lock in profit earlier so if the market does go against you, you can still come out on top.
Now that the analysis is done on the daily and weekly charts, we can narrow down a little further and take a look at the 4-hour chart to look for more swing range milestones that line up with our 7127-7133 cluster.
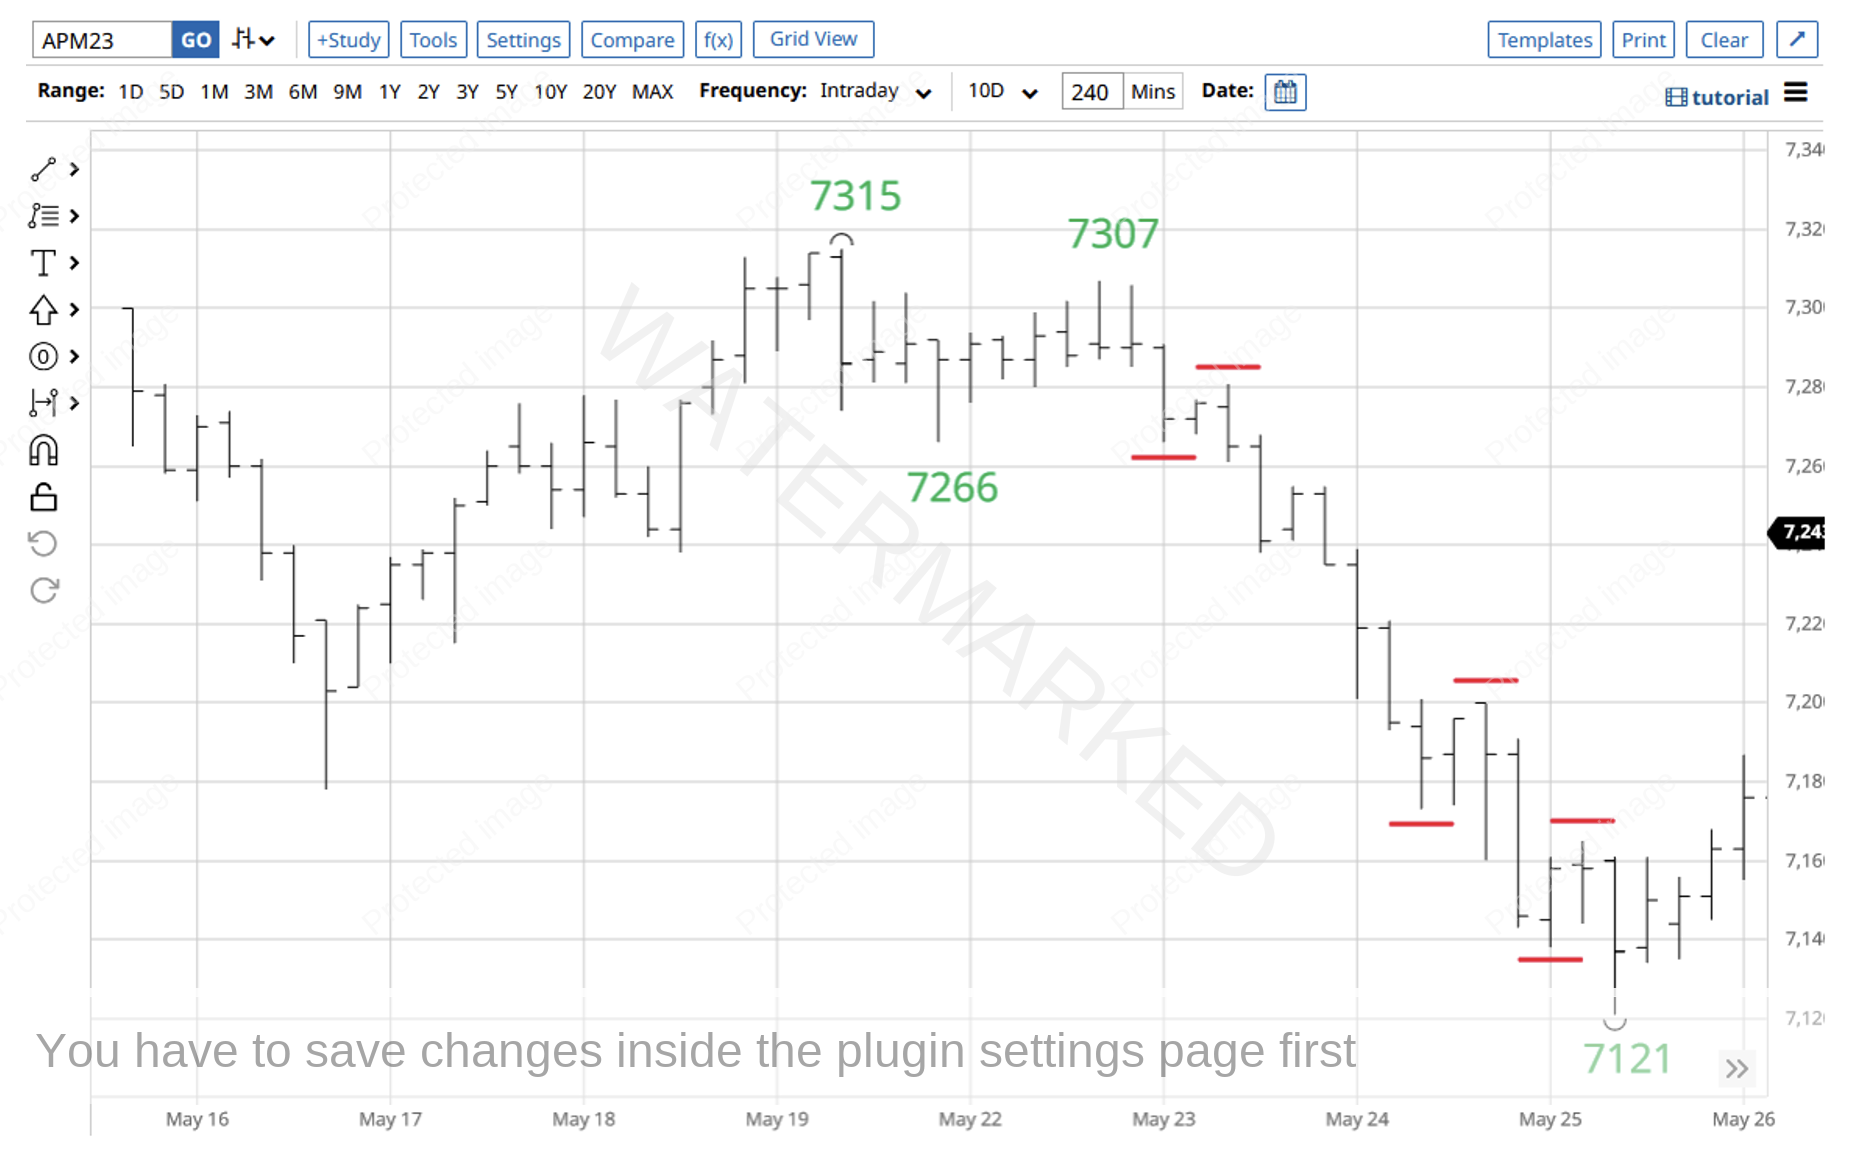
The first thing I noticed was a contracting 4-hour swing range into the low at 7121.
My challenge to you is to open up a 4-hour chart of the SPI (below is the SPI200 June contract in barchart.com) and find one, 4-hour repeating range (within a few points) that could add to the cluster.
Chart 3 – 4 Hour Bar Chart
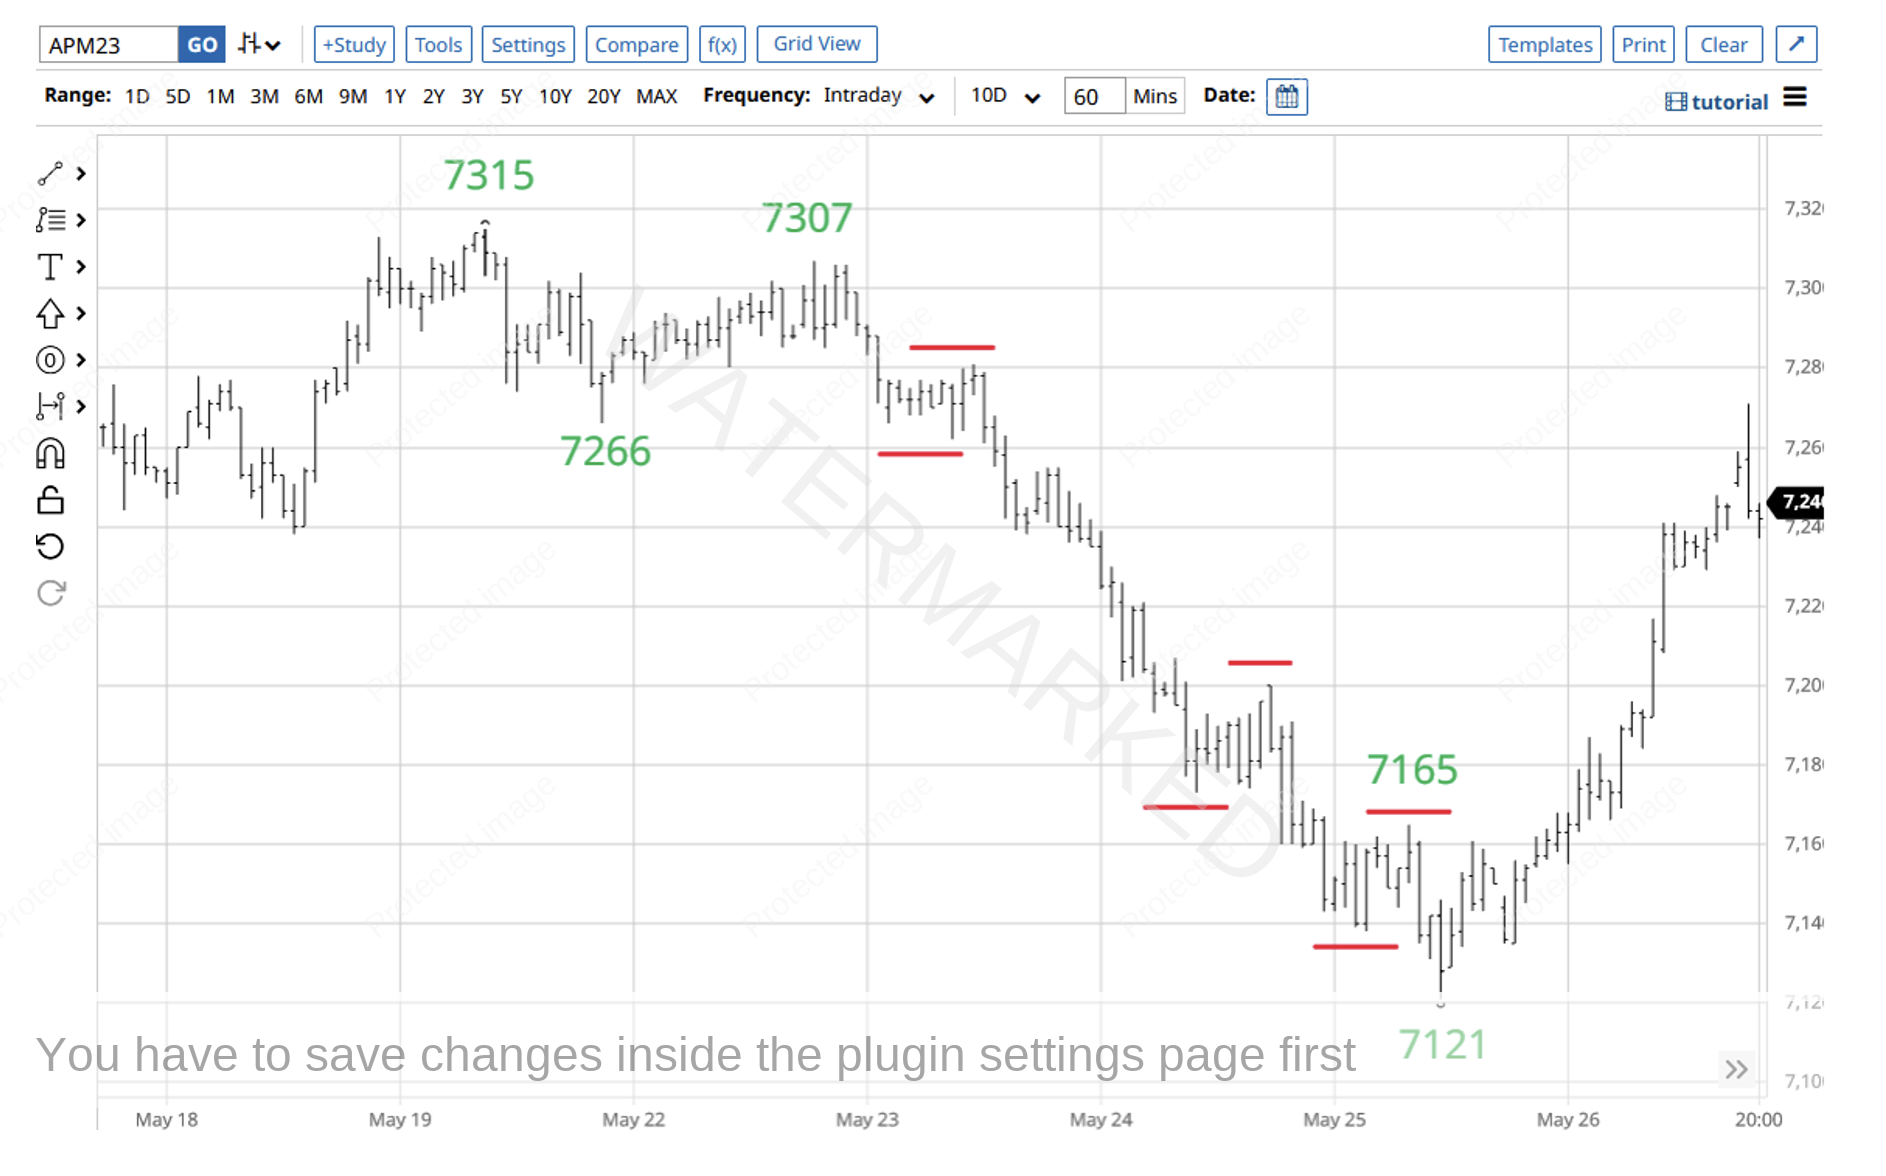
With a contracting 4-hour swing range, you can drill down even further with a 1-hour swing chart. In Chart 4 below, there was another 1-hour swing chart milestone that added to the cluster and gave another ‘sign of completion’.
Chart 4 – 1 Hour Bar Chart
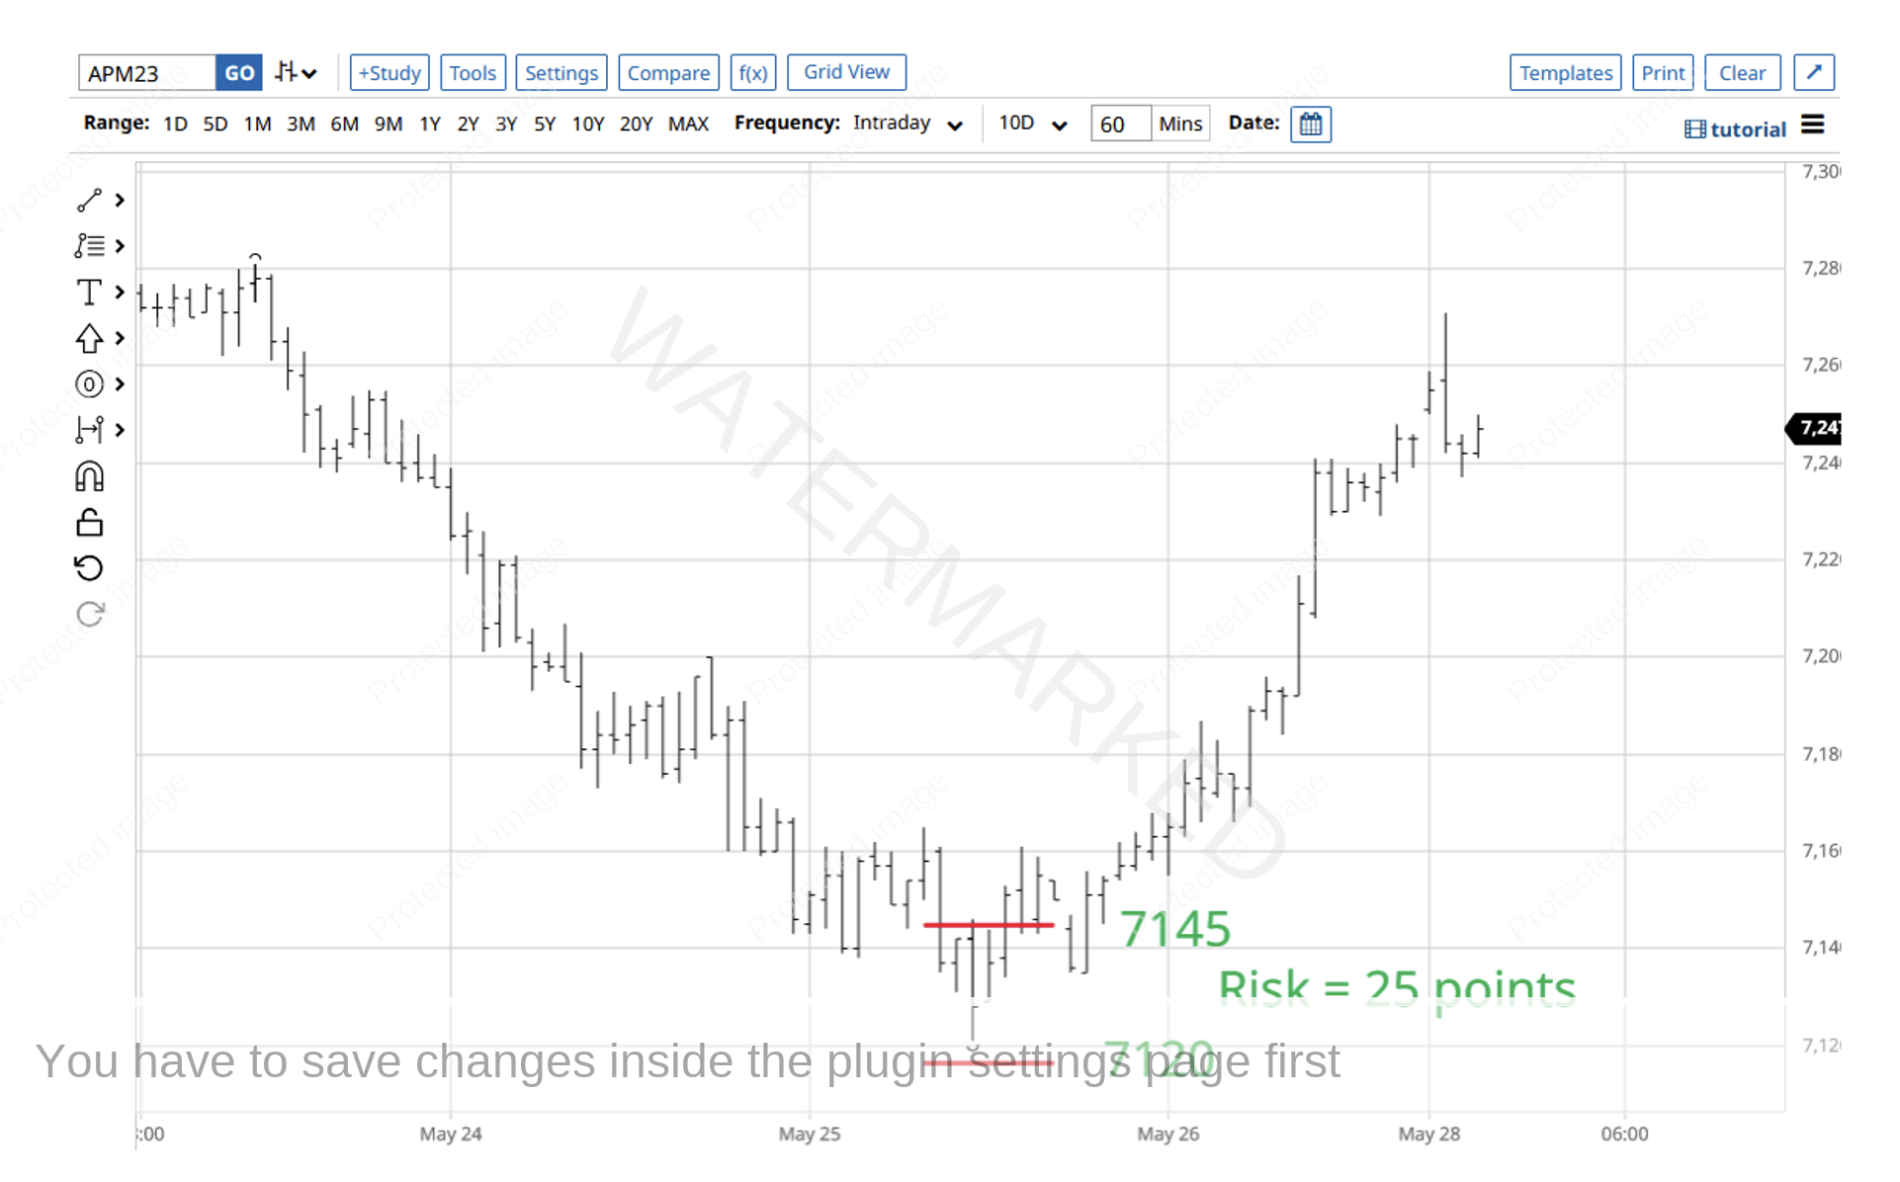
There are a number of entry strategies applicable to this scenario. However, if you chose to enter as the 1-hour swing chart turned up, when the high of the 1-hour inside bar was crossed, you would have gained entry at 7145 with a stop loss at 7120 and a risk of 25 points.
Chart 5 – 1 Hour Entry
At the time of writing, you could easily have your stop loss at break even or at a point which locks in some profit. To take a 10 to 1 Reward to Risk Ratio trade, the SPI would have to move 250 points from the point of entry at 7145 and hit 7395. Is this possible? 7395 points would be 5 points short of the 150% milestone of the current Double Bottoms.
Chart 6 – Key Double Bottom Milestones
By next month’s article, we’ll know how this trade unfolded and what kind or Reward to Risk Ratio trade it ended up being!
Until then, happy trading.
Gus Hingeley
