200% on Telstra
Welcome to the June edition of the Platinum Newsletter! One of the great rules that David teaches us in the Active Trader Program is the double tops and bottom pattern and its ability to repeat 200% of the A-B range. Quite an interesting phenomenon if you think about it! Although not all double tops or double bottom formations reach their 200% milestone target, many do and it’s a great target to start out with.
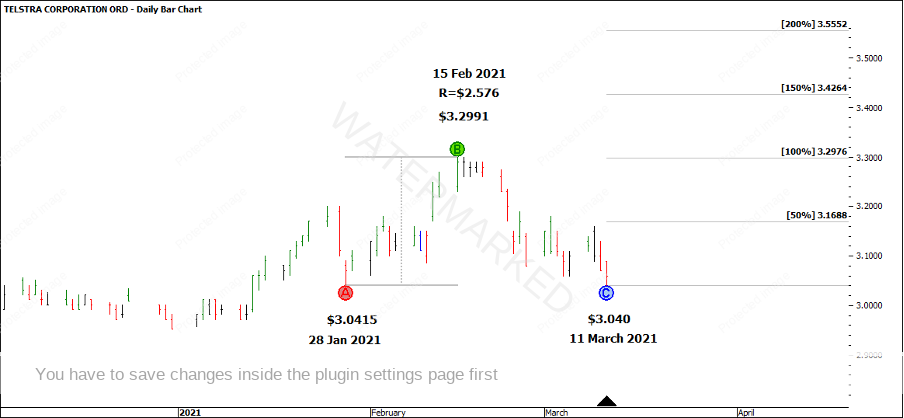
Chart 1 shows a recent example of a double bottom on an Australian stock Telstra that occurred on 11 March 2021. Those who attended History Repeats on Saturday would be very familiar with this stock!
Chart 1 – Telstra Double Bottom
As you can see above, I’ve quoted the price to 4 decimal places as that is what ProfitSource provides us with. However in reality, through my broker, I can only trade to the 3rd decimal place with a minimum tick size of 0.005 points. The main point I wanted to highlight here is this double bottom setup also had a very slight false break of the first bottom made on 28 June 2021.
There are plenty of reasons this could be a Classic Gann Setup. There were ranges, Time by Degrees, angles, and a great example of the Advanced Ranges Resistance Card rule in action that you’ll find in the Active Trader Program Online Training course if you have this in your member’s portal. The setup, however, I will leave to you to explore further.
The purpose of this article is to show how you could have entered and managed this trade for a conservative 14.75:1 reward to risk ratio using the following simple trade entry and management rules:
- Trade a weekly swing using a 4-hour bar chart for entry.
- Trail stops behind weekly swing lows.
- Take one additional daily first higher swing bottom entry trade and lock in profit.
- Exit at the 200% Double Bottom milestone 55 days later.
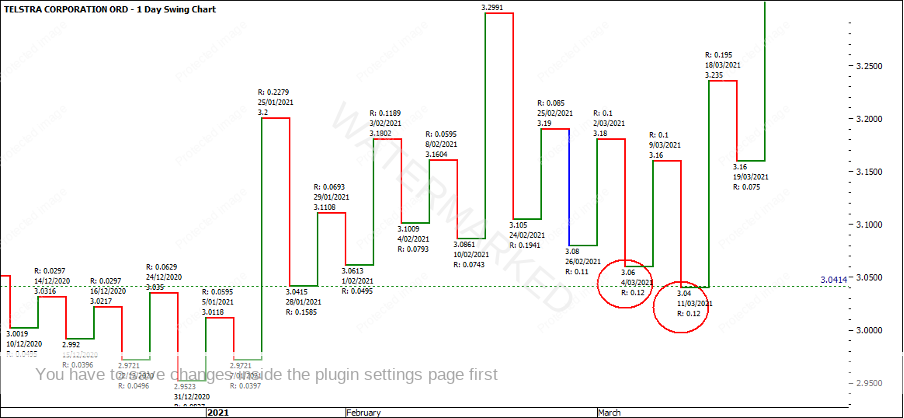
Chart 2 shows the repeating daily swing range (also check the hourly chart for repeating time ranges) into a false break double bottom which is a great starting point to kick off a campaign.
Chart 2 – Repeating Daily Swing Range
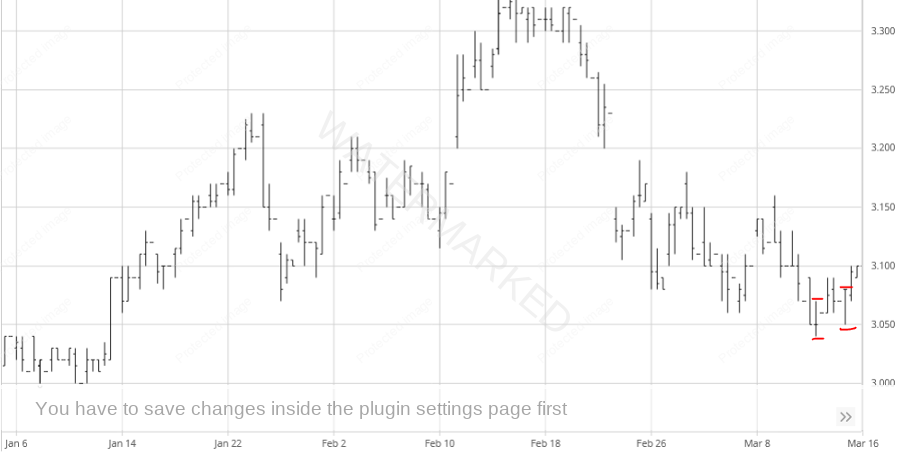
Chart 3 shows how on a 4-hour chart you could have easily traded the extreme low, or potentially even the 4 hour first higher swing bottom. The nice thing about this false break was the market only false broke the previous low once.
Chart 3 – Four-Hour Bar Chart
For the purpose of this exercise, I will use the First Higher Swing Bottom as our means of entry as it had a nice deep retracement and was a contracting swing range down. The details are as follows:
Position 1:
Entry Date: 15 March 2021 Position size: 500/0.04 = 12,500 CFD
Entry Price: $3.085 Total value: $38,562.50
Initial Stop: $3.045 30% Margin Requirement: $11,568.75
Risk per share: 0.04 cents Target: 200% of A-B range = $3.555
Capital at Risk: $500.00 Potential Profit: 3.555-3.085 = 0.47 cents x 12,500 = $5,875
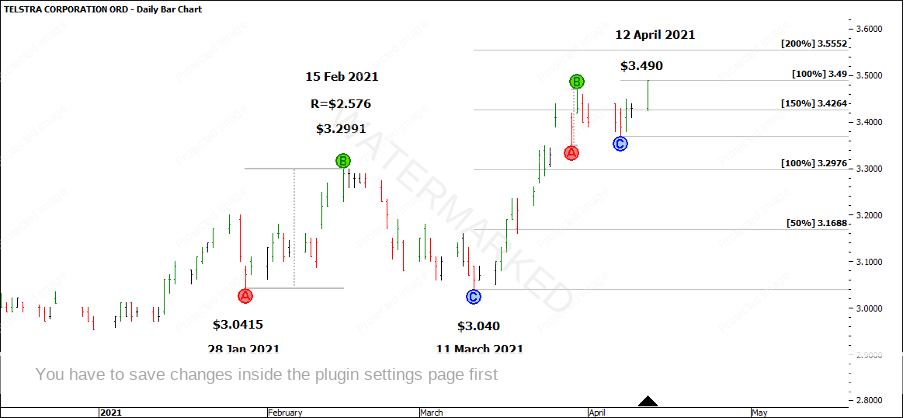
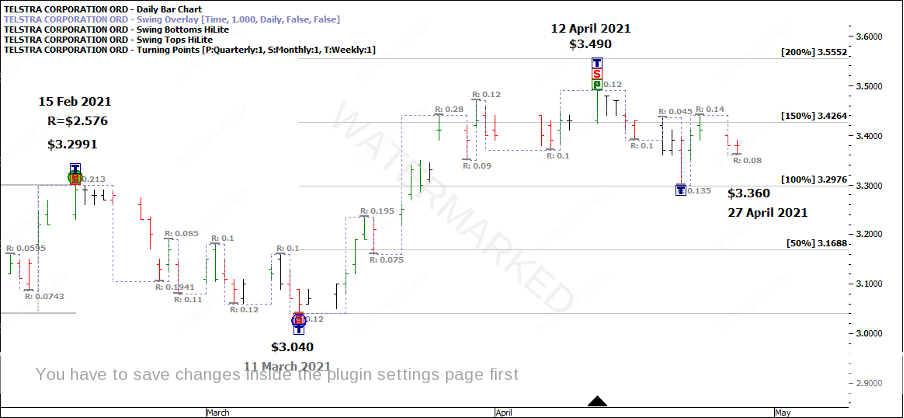
Now that we have entered the market, I feel it’s good to forget the 4-hour swing chart and return to the daily chart. Let’s fast forward 1 month to 12 April. In Chart 4 you can see Telstra has rocketed up towards the 200% milestone and the daily high sits at $3.490 which is an exact 100% repeat of the previous daily swing. If this had lined up with the 150% milestone or 200% milestone of the double bottoms, then perhaps this may have been a great place to take profits. However, it didn’t, so maybe you can conclude the move up isn’t finished. At this stage, there is no weekly higher bottom so stops haven’t been moved. In reality, I would move to entry plus commission to lock in at least a break-even.
Chart 4 – No Cluster
Fast forward again to 27 April and you have a daily first higher bottom out of an anticipated weekly low that’s sitting on an old top and 100% of the Double Bottom ABC milestone. With an expanding daily range up and contracting downswing range, this could be a fairly conservative place for a second entry to add to the initial position. If you look on the hourly chart, there were two clear sections down on the hourly chart that repeated exactly 100% into $3.360.
Chart 5 – Daily Higher Swing Bottom
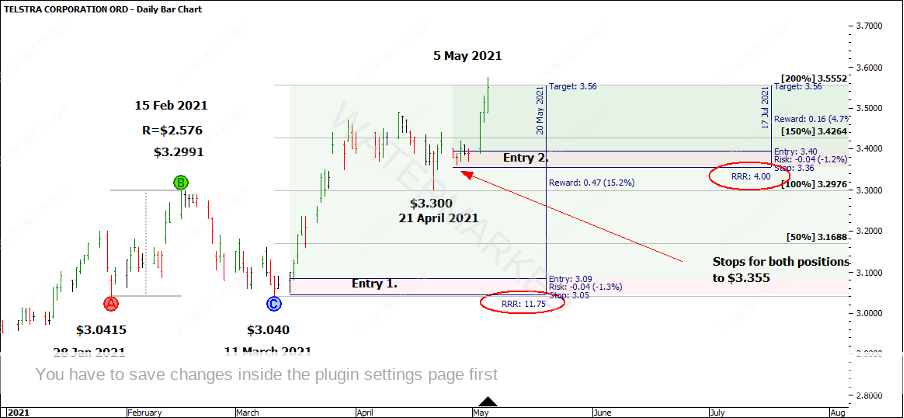
With such a small daily range bar of 0.040 cents, there is enough room for a 4:1 into the 200% milestone of the double bottom. That would make a total RRR of 14.75:1.
Position 2:
| Entry Date: | 28 April 2021 | Position size: 500/0.04 = 12,500 CFD |
| Entry Price: | $3.395 | Total value: $42,437.50 |
| Initial Stop: | $3.355 | 30% Margin Requirement: $12,731.25 |
| Risk per share: | 0.040 cents | Target: $3.555 |
| Capital at Risk: | $500.00 | Potential Profit: 3.555-3.395 = 0.16 cents x 12,500 = $2,000 |
At this point of entry, you have a number of different options of how you could move the stop loss for the initial position. You could:
- Leave the initial stop at entry plus commission until the weekly swing low is confirmed as per the initial plan.
- Move stops for position 1 under the anticipated weekly swing low as we’re taking an extra trade and putting more risk on the table.
- Use any combination of a split contract system to remove risk and or lock-in profit.
- Have both stops under the daily swing low of $3.355 which means you lock in a 6.75:1 RRR on the initial position (baring any large gaps on open outside of your control).
- Use any other combination that suits your personality and trading objectives.
On 5 May 2021, Telstra hit the 200% milestone of $3.555 and both positions are exited for a total of 14.75:1 reward to risk ratio in under 2 months.
Chart 6 – Completed Campaign
Total wrap up:
Position 1: Total profit = 0.470 x 12,500 = $5,875
Position 2: Total profit = 0.160 x 12,500 = $2,000
Total Profit = $7,875
For many moves, you don’t need to have an overly complicated stop management strategy. Here we had 2 entries, two trailing stop moves then one exit for a 14.75:1 RRR (before commission).
In next month’s article, I’ll be looking back at the SPI and the June seasonal date (which has just passed), the cluster that formed and how the market unfolded. What made me really excited about this June seasonal date on the SPI was a major low squared out in trading days on the 21st of June exactly. In terms of position of the market, the SPI looks to be kicking off a 4th weekly section up within this monthly section. How far will it go?
Happy trading,
Gus Hingeley
