4th Time Lucky
Digesting the information on hand at any given moment in markets is daunting and can be overwhelming. I am starting to see some of the directionless motion in markets change and a new potential cycle of movement to begin. When I analyse lots of markets, they all seem to have similar takeaways, many are stretched based on previous ranges, and they are lacking the conviction of buying we saw earlier in 2025. Maybe the lost motion of markets is catching up to the rhetoric or we could be refuelling for the next leg up?
The sideways or uncertain trends in many markets have been challenging in recent times, but rest assured they don’t last forever. When the clutter of the small picture impedes our view, we can step out of markets, step back and look for the big rocks. I have been working with Macquarie Group (MQG.ASX) in my last few articles and this market has produced a good run from our August seasonal time. There has been previous analysis on the power of seasonal time and Time by Degrees in this market. The lows around the 4th and 8th of August have acted as a springboard to retest the levels of approximately $230 per share that we have seen hold the market up in July.
Chart 1 details several techniques as we ran into the early August low of $210.82.
The last major run down was 66 calendar days, the stalled sell off failed to head lower after 34 days. Close enough to 50% for me when looking for repetitions or percentages of.
We can also overlay some price-based analysis whilst using the very last swing down into the April low. It’s critical that we work with our swing charts regularly as they will guide us to what we can expect a market to do and the numbers in terms of ranges we can look for.
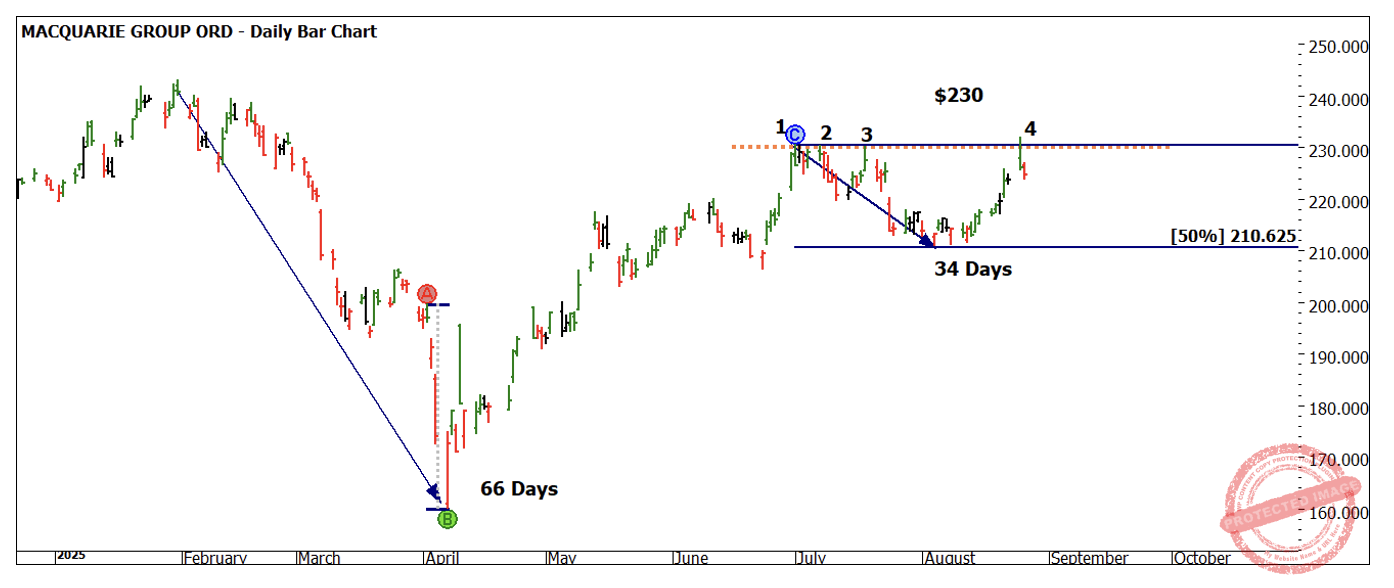
Chart 1 – Daily Bar Chart MQG
Charts 2 and 3 add some additional price pressure using a Ranges Resistance Card to add additional data for the price cluster at this level.
$210.63, $211.81 and 212.80
The average being $211.75
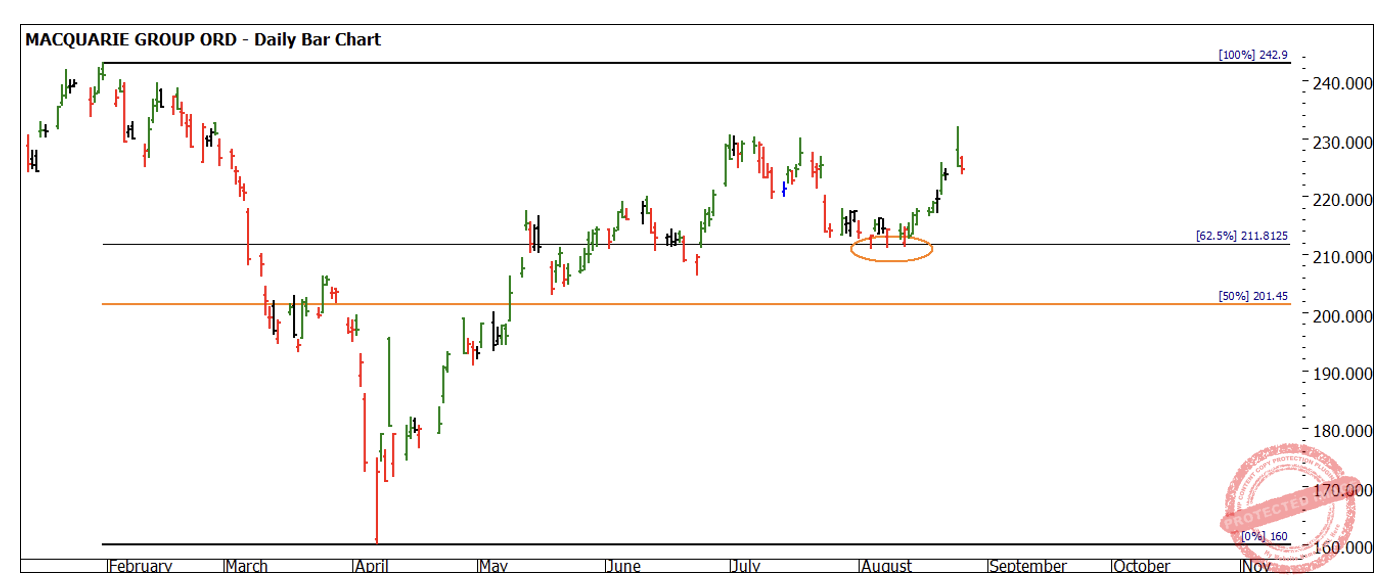
Chart 2 – Daily Bar Chart MQG
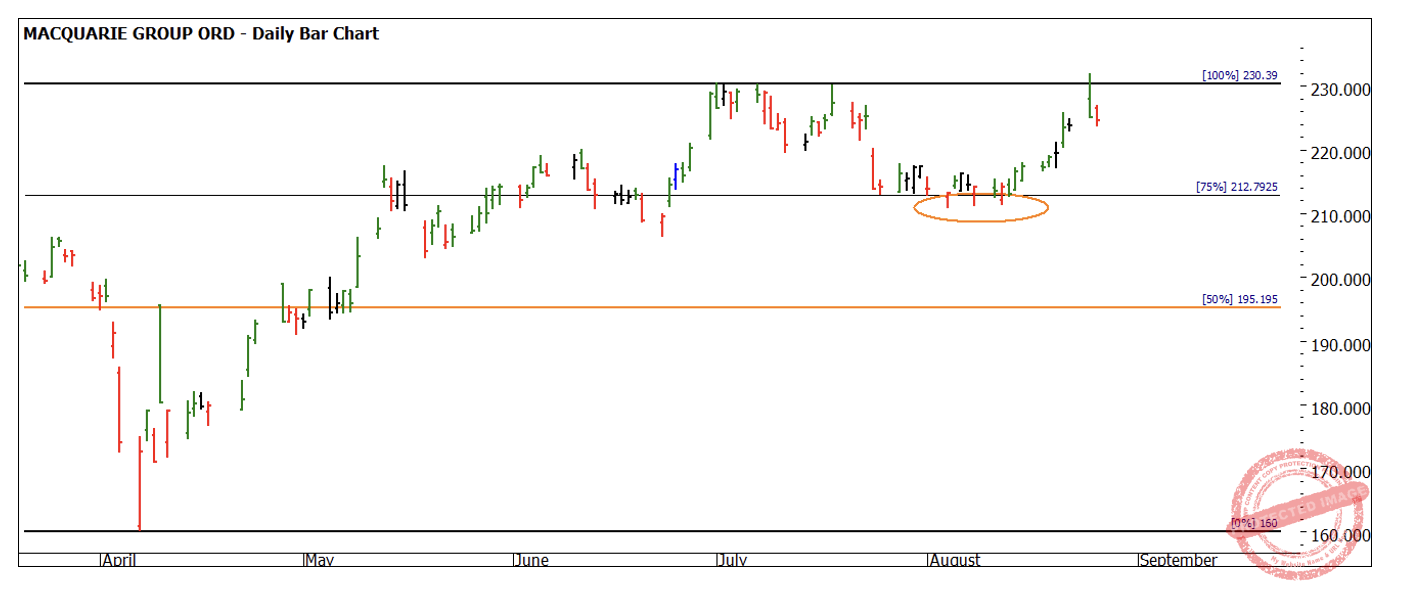
Chart 3 – Daily Bar Chart MQG
If we look to our swing chart in Chart 4, we can see that price, once it moved to the upside provided two clear swing ranges of above average range to the upside. In total close to a $20 move or around 10% of the stock’s price.
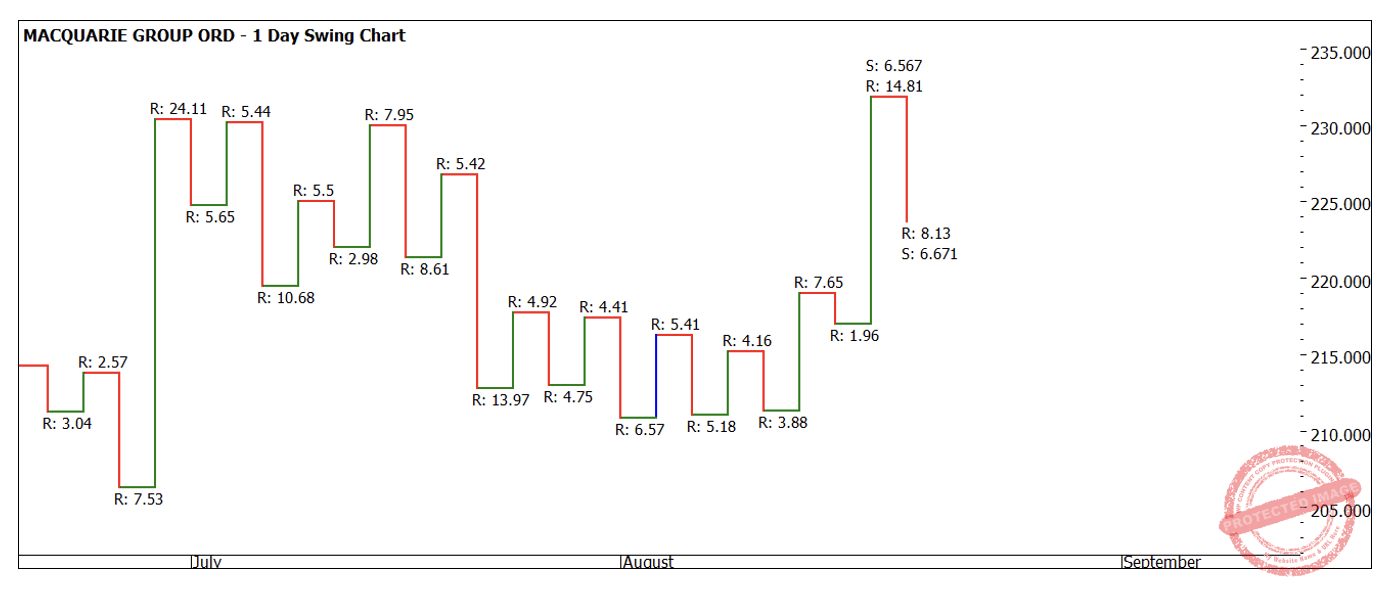
Chart 4 – Daily Bar Chart MQG
There are numerous ways you may have traded this move but it ultimately should align with your trading plan. The question for me now is will the price action on the 4th attempt break through the resistance or fail and retreat. Against the scenario of the ASX that has made record highs recently, many of the financial services business’ and banks have also moved higher, the test will be what this stock will do?
Chart 5 outlines the current position as I write and the previous range in the same direction. After an open close reversal at the 4th attempt there is obvious signs of resistance on good volume. History tells us the price of $234.93 would be a good area to watch for a repeating range.
If price action falls away from here, we could see the case of a short trade develop. The other options of more sideways or a higher swing bottom above $230 could also be trading ideas for the next move.
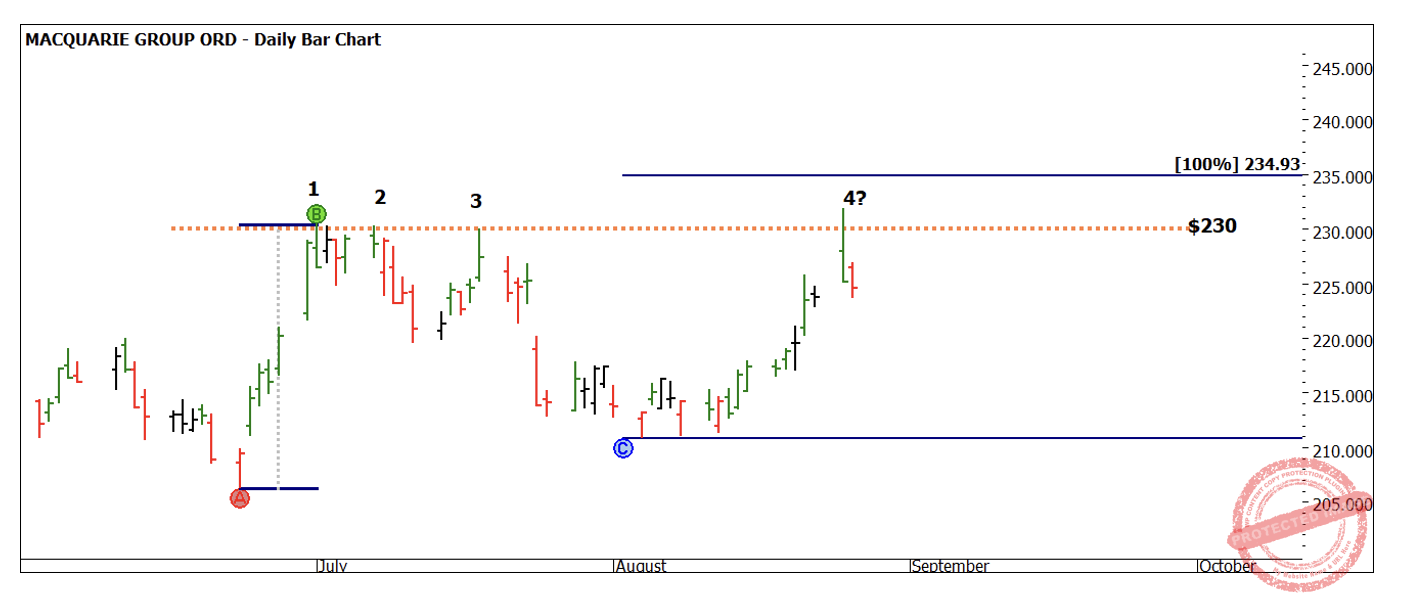
Chart 5 – Daily Bar Chart MQG
Now could be the time to be patient and let the market decide what’s next.
Good Trading
Aaron Lynch