Pass Me Another Piece of Charting Paper!
“May you live interesting times” is believed to be a curse from ancient times, however, JFK used the quote in a speech in 1966 to highlight the positives of the times he was in. This past week the Oil market delivered an event I had never factored into my thinking, that was trading at negative values. That is prices below zero, how is this even possible would be a question many may have.
I am still scratching my head on some of the future implications for charting going forward, but in short, trading got messy as the contracts were about to expire. The May contract was due to expire 21 April and as the open interest started to drop (the number of contracts still open) then players who did not want to make or take delivery of physical Oil had to unwind their positions effectively at any cost. Therefore, to find an opposite of your position to net your exposure to zero caused many participants to register windfall profits and losses. Of course, this is not an ideal situation where a major commodity traded sub-zero, but we do need to understand the context of it. The situation only affected the May 2020 contract and the next month in line was trading around $20 a barrel when all this as going on, so Oil still does have value. However, nowhere near the $147 a barrel high in 2008.
This lesson is a good one for all traders of commodities to be well clear of a contract before expiry. When I was teaching lessons on Oil for traders, I used a phrase as a reminder for us all on Oil, “you should never be trading the month you’re in”. That should keep you safe in most cases against events like this, there will be some traders out there with some war stories to tell about this event no doubt.
I will need to see the fullness of time play out to understand how this truly affects our charting, especially hand charts. Do we include the negative values on our chart or for now do we just keep following the SpotV chart as this will exclude this low volume event as an outlier. If you do plan to chart the drop, best contact Di for some more charting paper to tack on the bottom of your chart.
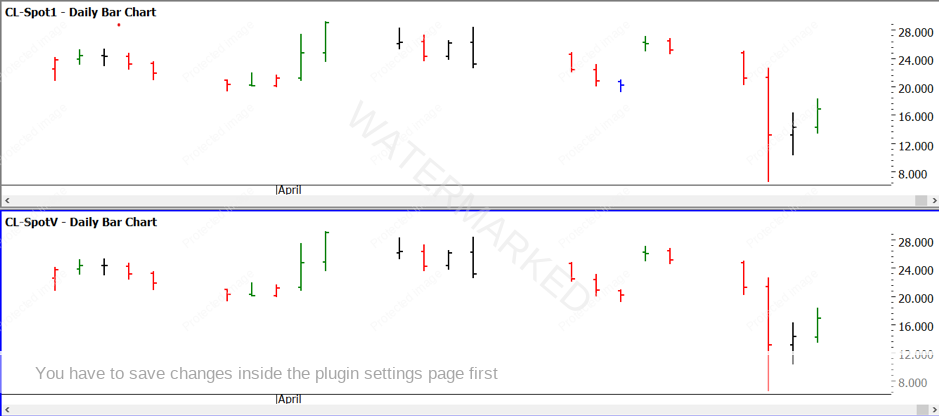
When I take a quick review of the Spot1 and SpotV charts in ProfitSource (best done in a split-screen view) we can see that there is no difference in the charts as they have not attempted to chart the negative values. In cases like this, it reminds me of the value of keeping a hand-drawn chart as we can choose to include or exclude outliers like this.
Chart 1 – WTI Crude Oil Spot1/SpotV Bar Chart
What we do know, regardless of what chart we look at, is a new low has been triggered at $6.50 in the June 2020 contract. This will mean we now have a new low to test in terms of price and time. In simple terms, 650 points and 650 days will now become viable targets and areas to test into the future. We can also follow basic Gann theory by taking that number and looking at fractions/percentages of that number. Gann used to say we can divide and multiply by 2, 3, 4 and 8 to start with. The table below uses 650 as our new prime and the basic calculations either side.
If you have followed Crude Oil, then you should see some numbers in there that get you excited. It continues to show that markets are just images and mirrors of themselves just broken up in mathematical pieces. Once you have a handle on the numbers you then start to see the patterns.
We can also explore the relationship between the previous all-time low on 1 April 1986 at $9.75. If we see the price difference between the two, we can compare $6.50 to $9.75. A quick calculation shows that the $6.50 x 1.5 = $9.75 exactly. We know the 150% milestone has a great deal of relevance.
The amount of calendar days between the 86 low and the current new all-time low is 12,439, could there be more to the story if you test that time frame? I will leave that to you to explore.
The overall picture of the market is one we can explore on a larger time frame. Now that the all-time low has been broken we now must wait for the new low to remain intact before we start to place too much relevance on it. If the low is out of play, we can move to the other extreme the all-time high.
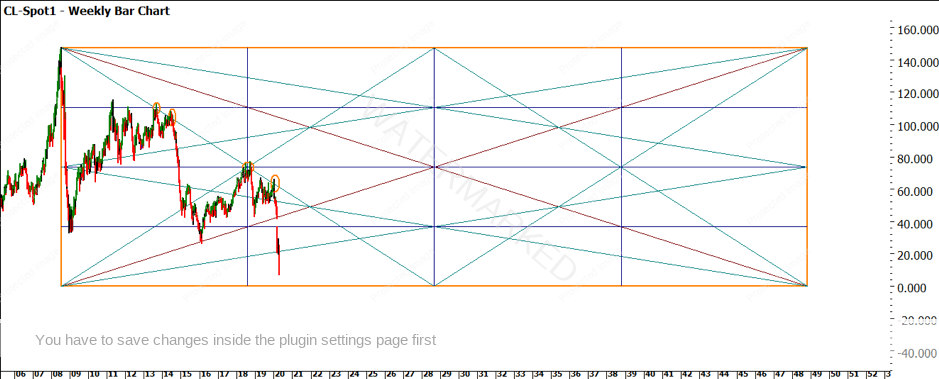
Chart 2 -Crude Weekly Bar Chart
Chart 2 shows us how some of the angles within the all-time high square are offering some points of resistance. We can also see how the recent price action has held off the 1 x 2 zero angle using the date of the all-time high. This chart is a noticeably big picture view but can be useful to zoom out and look for big picture patterns. You may not see the price action react with the angles regularly but when it does its worthwhile paying attention.
There are some useful repeating price ranges we could be watching as well in terms of previous reference ranges; these charts and techniques would be ones that would be part of a normal routine and reviewing charts.
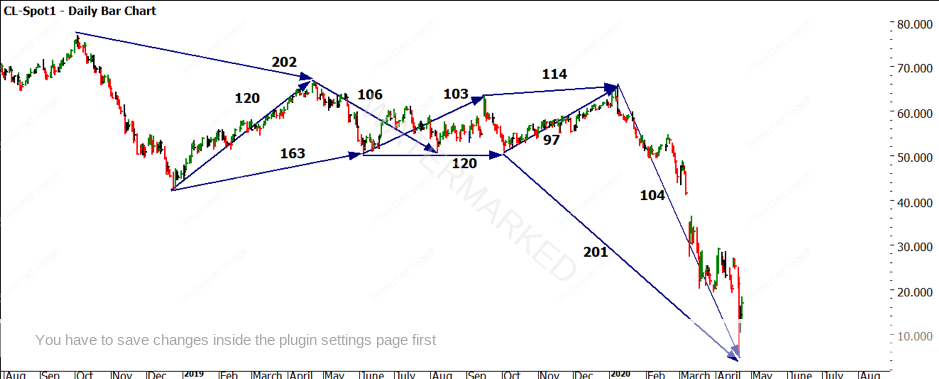
The final chart I have for you shows some time frames that have been appearing recently. We know the importance of 52 and its multiples, Chart 3 gives some weight to the low in terms of repeating time frames. It will be interesting to see what happens next, but we are definitely into a new chapter on Oil.

Chart 3 -Crude Daily Bar Chart
Good Trading,
Aaron Lynch


