Don’t Kick the Cat!
Welcome to the May edition of the Platinum Newsletter. As always there seems to be no shortage of things going on in the markets right now. This month I wanted to write about the feeling of frustration when a good looking trade setup doesn’t go your way. It’s easy to let your emotions get the best of you, and perhaps kick whatever is lying close by! However, you can often extract a valuable lesson that could help you grow as a trader. This is a good time to remember David’s quote, “Don’t fall in love with your forecast”. I’ve found with any of my forecasts if I only have one scenario listed out it’s just too easy to feel like this setup ‘has’ to work. Overtime a valuable lesson I’ve learnt is to come up with a few scenarios of how a market may play out around these Classic Gann Setups so I can still look at it subjectively and identify whether or not it’s unfolding like Scenario A, B or C. This has been very helpful on a psychological level and really reduces my desire to force a trade when it doesn’t quite line up.
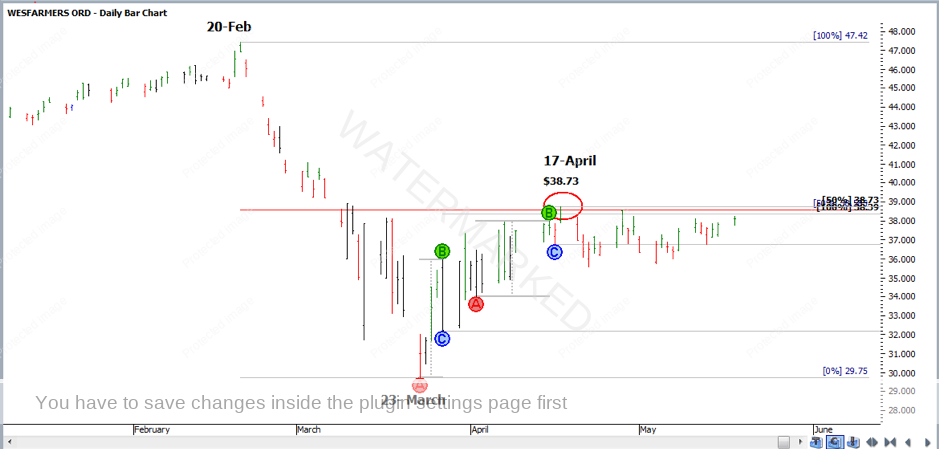
Last month I wrote about the cluster on Wesfarmers at around $38 and the daily Overbalance in Price to the downside out of the 17 April top. In Chart 1 you can see since then, Wesfarmers gave a First Lower Swing Top entry signal that would have been a loss if you had taken it. This market put in a failed daily swing up in late April followed by an expanding daily swing down in early May. We then saw another failed daily swing down followed by an expanding swing up! At this point, the market had gone absolutely nowhere for about 3 weeks.
Chart 1
When I came back to this setup the other day with fresh eyes, I started to see the elements for a Classic Gann Setup come together again.
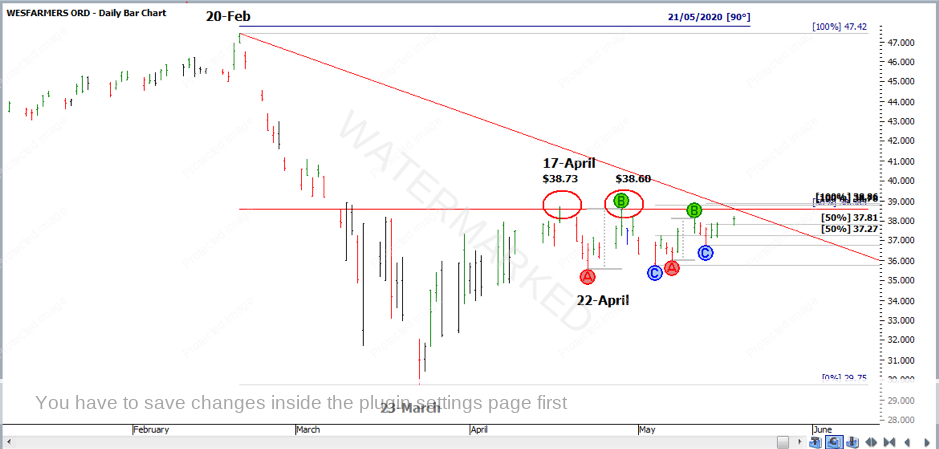
In Chart 2 below, I demonstrate the main elements that stood out to me for a potential Classic Gann Setup.
Chart 2
I saw the potential for Triple Tops on a 50% retracement with a repeating weekly range and a repeating daily range on a Time by Degrees day. This was also 90 degrees after the February top and coming up underneath a 1×1 angle. Out of the 4 May 2020 weekly swing low, I can still apply Position of the Market and see 3 small daily swings up which clustered with the 100% milestone of the weekly swing chart. My Form Reading tells me these are good milestones to watch as the 50%s for both ABC milestones have been working. David says give the markets a day or two tolerance around a Time by Degrees date which pretty much gives any time from the 19th – 22nd of May for a potential top.
So I have my Classic Gann Setup to watch over the next week. All I need now is a signal bar once the Cluster is hit and I can apply my Trading Plan. I have Time, Price, Position and Pattern, although there hasn’t been much volatility over the past month. Is that a concern? I’m not too sure.
The following scenarios are ones I have considered in terms of how the market may unfold.
Scenario A -This sideways month is a little bit of distribution and we see the Classic Gann Setup hold which starts the next run down.
Scenario B – Potentially we see the market push straight through the target with more upside, and in that case, I’ll wait for the next cluster.
Scenario C – Perhaps we see the market continue in a sideways pattern and end up being a terrible market to write an article about!
Fast forward a couple of days to Tuesday 19 May and Wesfarmers opened up with a gap and closed on its low of the day which was the signal bar I was looking for. However, I felt there were some alarm bells. The gap up and the close of the day were both well above the 50% retracement and the daily and weekly ranges were now expanding, not equal or contracting. This didn’t look right and I thought it was perhaps best to let it slide. Interesting to see that the next day opened with a gap down, ran down a little bit further and then spent the rest of the day running up. First, it got back above the 1×1, then the 50% retracement, then above the 100% milestones and back above the previous day’s close! Hardly the sign of a ‘weak’ market, unfortunately. Interesting though, what was once resistance is now looking a lot like support.
Chart 3
Wesfarmers may be starting to shape up like Scenario B, and perhaps, I should be looking for the next cluster in the market to the upside. Although Scenario A could still play out as this may just be a ‘false break’ of the 50% retracement, however, I would like to see it get back under the 50% level before I would consider trying to short it.
So even though I am unsure as to what this market is doing, I can sit on the sidelines, protect my financial and emotional capital and just watch and learn as Wesfarmers tells its story!
Happy Trading
Gus Hingeley


