ProfitSource – The Wall Chart Wizard
This month’s article gives an example of how to use the Wall Chart Wizard in ProfitSource to produce your own chart. I’ll get stuck into it straight away….
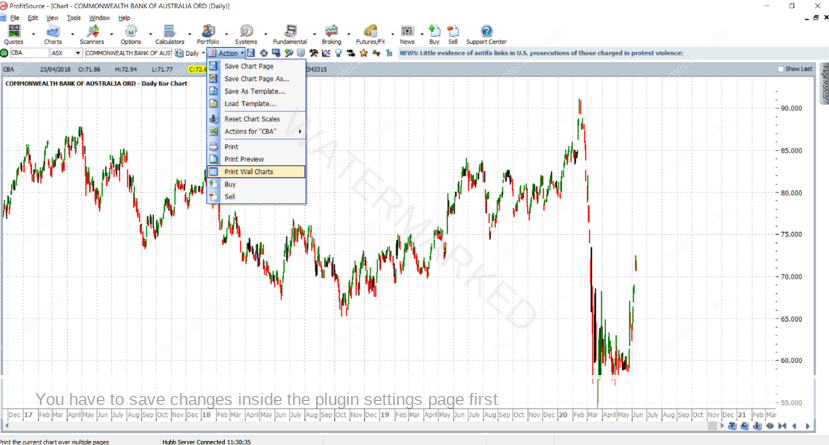
Open the chart of your choice in ProfitSource. For this example, we’ll use CBA:ASX
Select Action -> Print Wall Charts
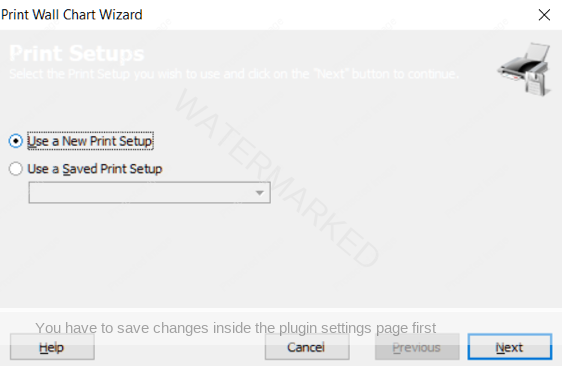
By default, “Use a New Print Setup” should already be selected. Click Next…
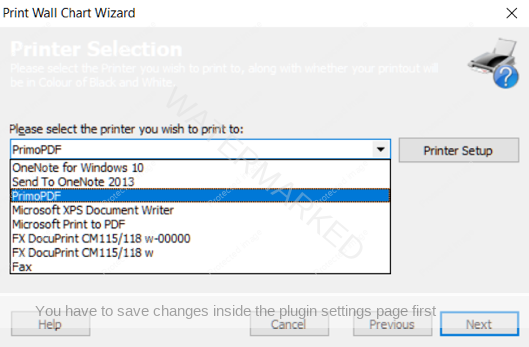
Then select a third-party to produce the chart. For example, something like PrimoPDF is a freely available piece of software which we can install and use, in conjunction with ProfitSource, to produce the finished product – a PDF file of the wall chart. This PDF can then be printed by a company such as Officeworks on A1 chart paper, for example.
Before clicking Next, note in this example that I have left the default setting “Print in Black and White”.
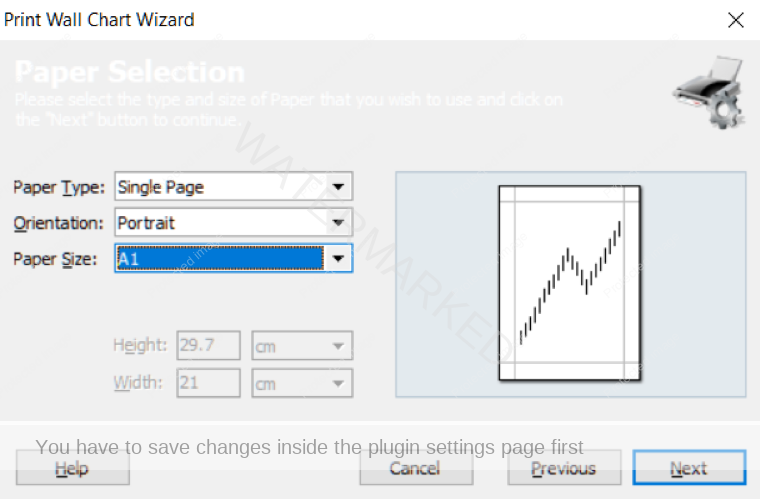
Now set the “Paper Selection” criteria as follows, then click Next.
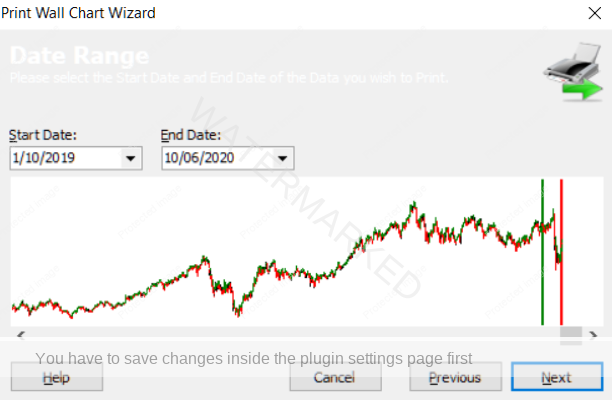
Select the date range. Let’s make it from 1 October 2019 in this example, so as to include at least one significant turning point and/or price range in the market.
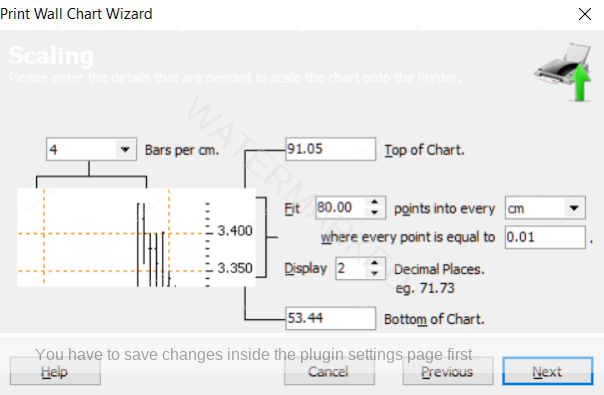
And next is the scaling. This can be an important step to experiment with, depending on your market and the scale which you want to appear in the finished product. Remember if you need to change anything before you finalize the chart, it is ok to come back to this step (by pressing the “Previous” button) and adjust the scale again. Please also note that WD Gann charted using inches rather than centimetres. ProfitSource gives you the option to use either inches or centimetres.
Experiment with the Grid Style settings if you feel the need. In this example, they have been left at their defaults.
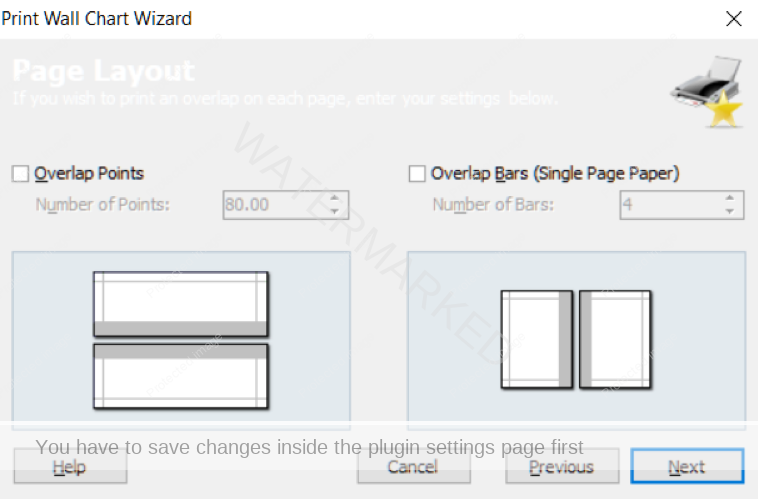
The next step has some overlapping options, which you can use if you will be printing out more than one page. For example, you may need to sticky tape or glue two pages together. This option duplicates some of the data, making it easier to join multiple pages together later. If you are only printing a single chart, just ignore these options and move on.
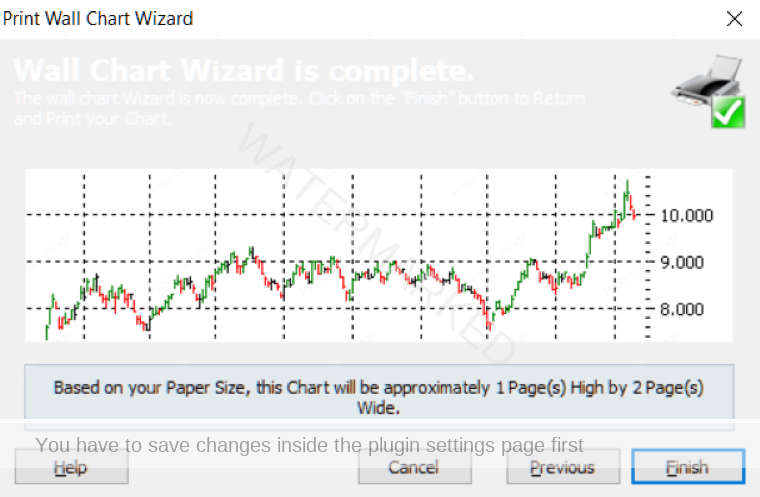
Almost there. If you’re happy with the layout, click Finish, otherwise if the Wizard is looking to produce more PDF pages than you’d like, click “Previous” and go back to adjust the price scale settings, or bar spacings, or date range.
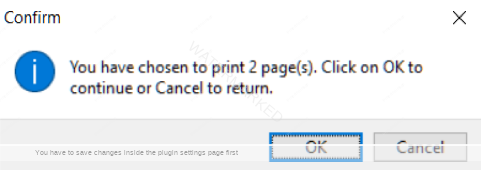
Then, you’re prompted for confirmation, with the option to back out, and go back to make adjustments…
And then it’s probably a good idea to save your settings in case you want to come back and fine-tune them later on before printing.
Now on to producing the actual PDF file(s) with some third party software like PrimoPDF. This should automatically open after a few seconds if you have downloaded and installed it. Click on Create PDF.
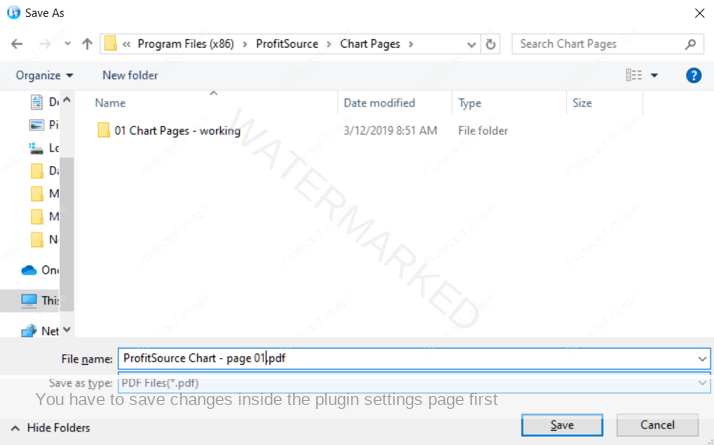
Then you will be prompted to save the resulting PDF file(s) in a known location on your PC.
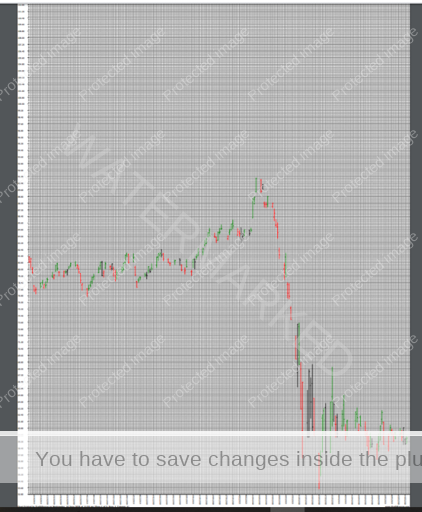
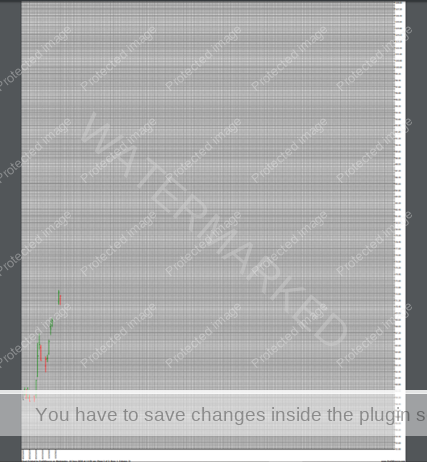
And after that, by default, your third-party software will usually open your PDF file(s) for a preview. Here is a screenshot of the two that have been produced for our CBA example. Obviously they’ll look much better when printed for real as two A1 sized sheets!
And then you’re done – copy your PDF file(s) from your PC onto a USB, and off it goes to the printer. Alternatively, you can upload the files directly to your printer.
Remember the settings I have used in this article are only for the purpose of an example. Play with the settings for your own chart. Tweak them until you are happy. It may take a few goes. Each time make sure you view your PDF file in full before taking it for printing. Be patient – it might take a little practice.
Work Hard, work smart,
Andrew Baraniak
