When in Doubt
Something that all traders experience on our journey is doubt, whether that be about our next or current trade, our trading plan or even our overall success as a trader. It is something you should get comfortable with and try to isolate as early as possible. Doubt is often experienced at the beginning of your journey and as you start to become wiser and more experienced you will notice that there is a large correlation between the systems and process you have implemented and the level of that doubt. Whatever stage you are at in your trading journey, the challenge is how to deal with this doubt.
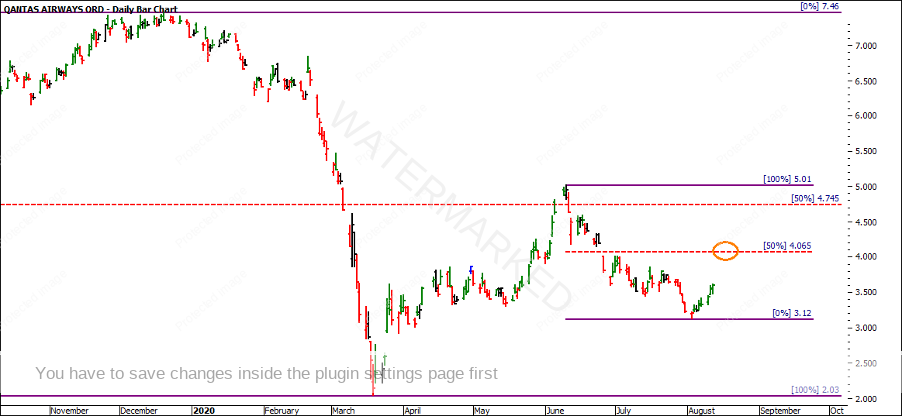
Looking back to last month’s article, Flying Solo on Qantas (ProfitSource code QAN), our prognosis was to verify the likelihood of the market getting to approximately $4.06 which was retesting the 50% level, followed by retesting the COVID 50% level at $4.74, as seen in the chart below. The market was able to retest the $4.06 level and made a top at $4.09 on the 8th of September 2020, yet the market has now slowed and looks to be trending sideways, causing doubt around the prognosis.
Chart 1 – Qantas Daily Bar Chart
Gann wrote about doubt in the W.D. Gann Stock Market Course and said that:
“When you are in doubt about the position of a stock and do not know what its trend is, you should, of course, not trade in it. Wait until it shows by breaking resistance level, or crossing a resistance level… before deciding which way it is going to move, especially after it has been in a long deadlock, or in a sideways movement…”
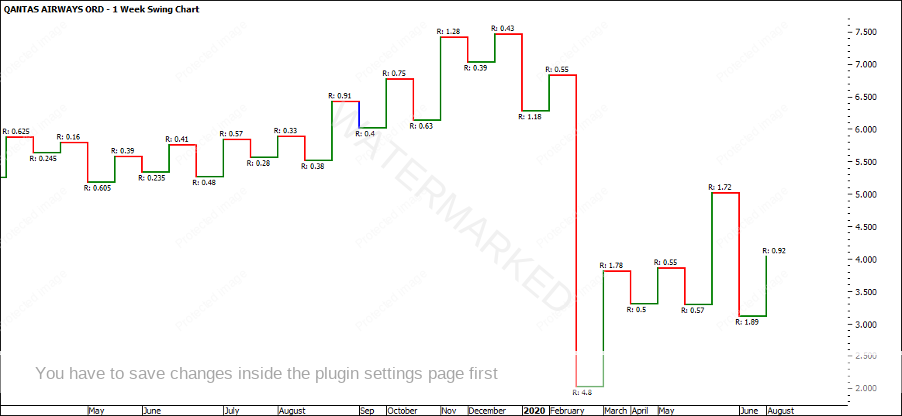
Turning to our swing charts we can analyse the true position of Qantas and determine what the market is telling us just by simply following our plan. As you can see from all of the swing charts below, the 1 day, 2 day, 3 day and weekly chart are uncertain.
Psychologically, we are thinking that we need to find a trade as we have already previously done the analysis and set our prognosis, however, we must be wary of forcing the trade. Understand that trading isn’t about getting into as many trades as possible, but about analysing, verifying and then executing. A well-seasoned trader will know that they are currently seeing an uncertain trend and will have the discipline to wait for the breaking of resistance or crossing of a resistance level before deciding as Gann mentioned.
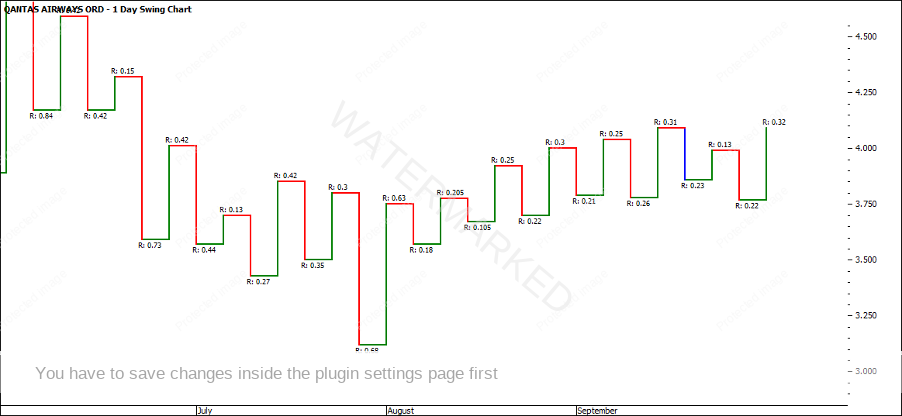
As you can see the 1 day swing chart is showing higher tops and lower bottoms.
Chart 2 – Qantas 1 Day Swing Chart
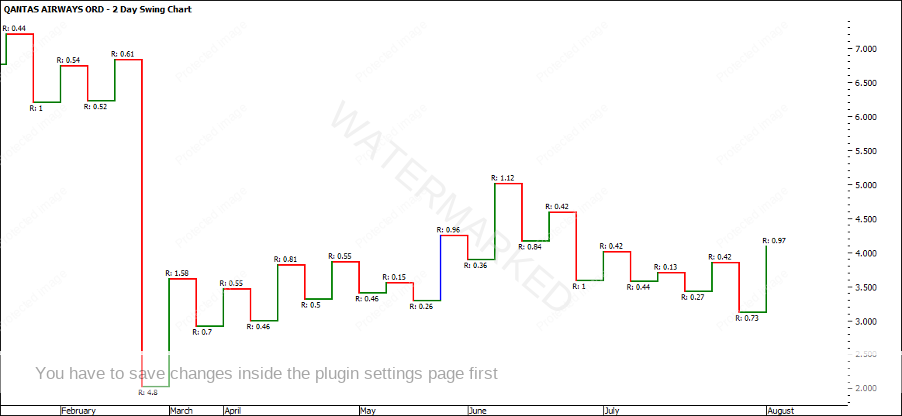
The 2 day swing chart is showing higher tops and lower bottoms.
Chart 3 – Qantas 2 Day Swing Chart
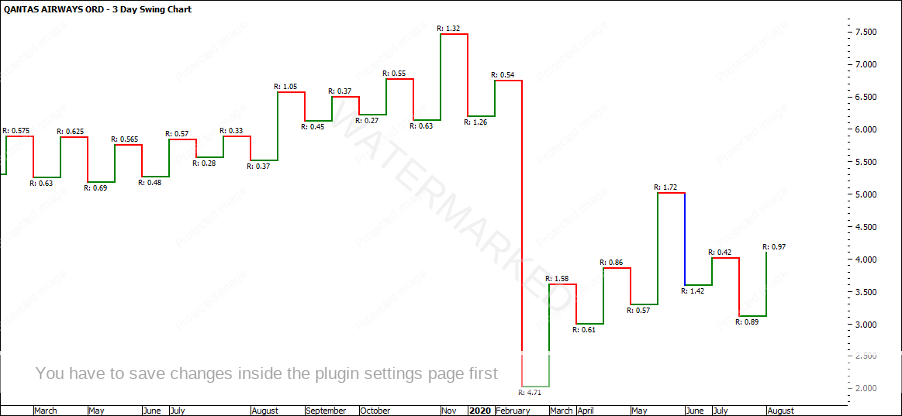
The 3 day swing chart is showing higher tops and lower bottoms.
Chart 4 – Qantas 3 Day Swing Chart
And the weekly swing chart is showing higher tops and lower bottoms.
Chart 5 – Qantas 1 Week Swing Chart
Waiting for the market to start ‘moving’ can often cause impatience, so establishing a checklist of what you want to see the market do prior to executing a trade is a way to have the discipline to follow your trading plan. The checklist can consist of resumption of the trend, breaking of resistance or support or even volume or temperature of the market.
Volume is a great indicator as you can start to see what the bulls and bears strengths and weaknesses are around certain price levels. Gann wrote about volume during times of doubt in the W.D. Gann Stock Market Course and said that:
“As a general rule, when a change in trend takes place of importance, the volume of sales will show it. The volume of sales usually increases when a stock starts to advance from low levels or from dullness, and the same after a long period of dullness at a high level when activity starts on the downside, the volume of sales increases.”
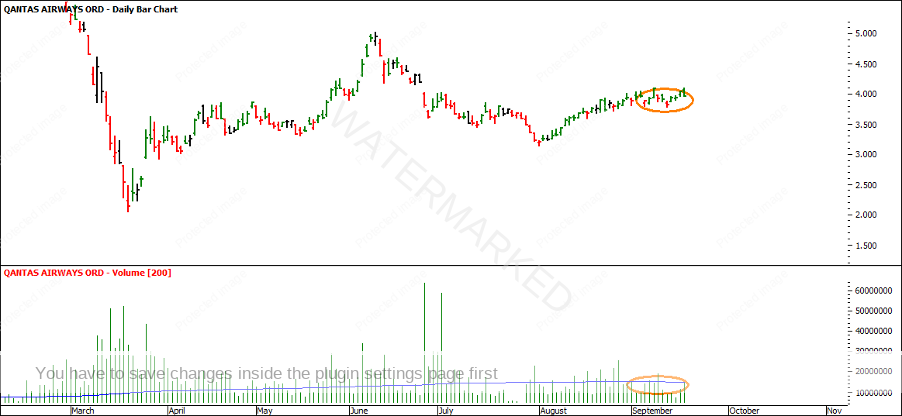
As you can see from the volume chart on QAN when the market started moving sideways the volume dropped off considerably. If you think about it, while the market seems to be sideways and stale, a lot of investors and traders put QAN aside and try find other trending markets to make money. However, this doesn’t mean that you should take your eyes off it yet.
Chart 6 – Qantas Daily Bar Chart
The scenarios you build into your analysis and the patience you implement to watch and observe makes you a wiser and more experienced trader. From my experience, you will notice that there is a large correlation between the systems and processes you have implemented and the level of doubt surrounding your trading. David spent six months out at a property in Tambo to put his complete trading plan together. Once the leg work has been done, you will spend more time reviewing and monitoring trades, followed by strategic execution. As David commonly suggests you want to spend 80% of your time identifying trading opportunities.
Too many times we try to make simple things more complicated! There are those who think simple means unsophisticated or impossible to generate money. They are very wrong and track records going back decades from many trend followers prove them wrong.
The key to success or compounding money over time is the ability to stay focused, stay disciplined, follow the plan, and have patience.
It’s Your Perception
Robert Steer
