A Classic Cluster
Although a considerable amount of time and preparation goes into our analysis, it is the actual trading that makes the money. We need to always be aware of that and have some ‘what if’ scenarios in place to take advantage of the next available opportunity in the event that our forecast fails. One key component to following up a forecast is form reading. David has many gems within the Ultimate Gann Course material, especially with the likes of form reading.
A Classic Gann Setup always seems to have the hallmarks of multiple resistance levels around a particular price and in a period of time. We call this a time and price cluster. However, often when a cluster of resistance levels don’t produce any significant reaction, we tend to disregard the trade, writing it off as one that didn’t work and sometimes taking it personally. *News Flash* the market is always right and doesn’t really care what we think! So, the next phase of a failed forecast is to see what we can take away from this potential cluster area. Have you ever thought to continue trading with the trend or review your forecast if it fails?
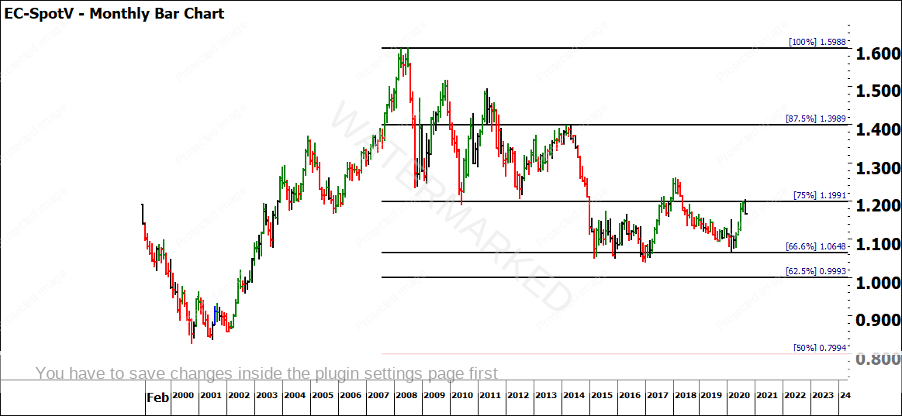
In this article, I will be reviewing the Euro against the US Dollar (FXEUUS in ProfitSource). The current market action illustrates a trending market, so there are potential opportunities for trading. The chart below is the Highs Resistance Card. As you can see the market has made numerous bottoms on the 66% level at 1.0648. It has found support and rallied into the 75% level at 1.1991. Note that it is a monthly chart and there didn’t appear to be any down months during the rally.
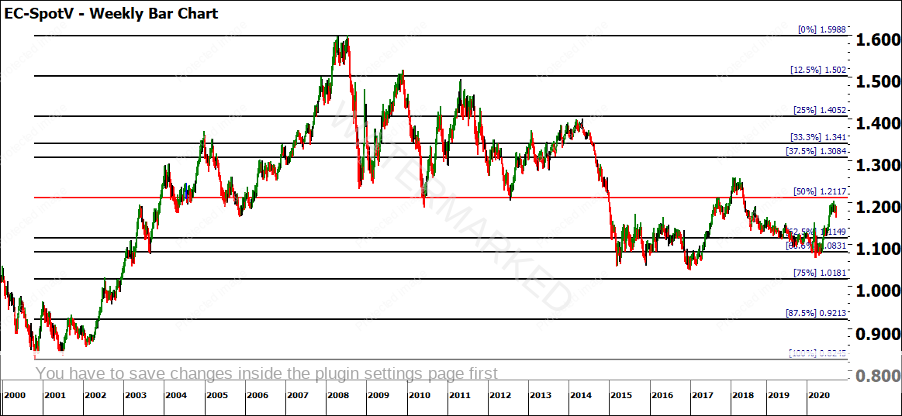
If we turn to the All-Time Ranges Resistance Card, we have just fallen shy of the 50% level at 1.2117. This level has played a huge part in the EURUSD chart for 10 years. Personally, I would have liked to have seen the market retest this level prior to pulling back. Since it hasn’t, questions arise such as whether this is a weaker market or whether it is just conserving energy and re-testing previous ground prior to shooting through to the upside. Only time will tell.
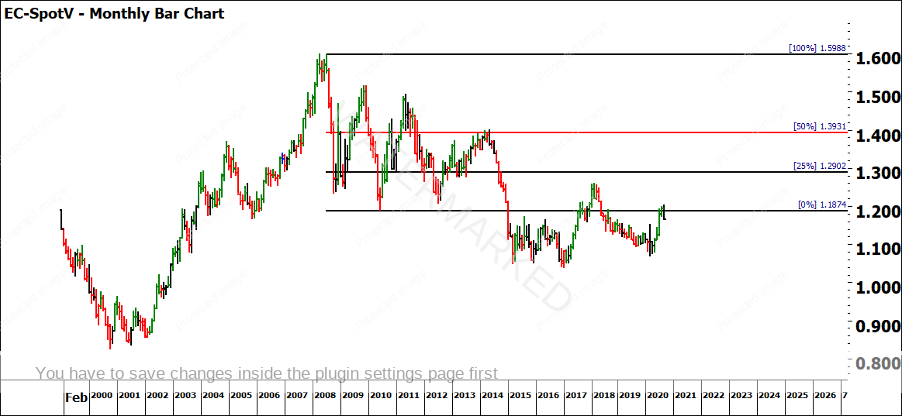
The previous GFC Range also played a large part, and while we have not re-tested any major milestones within this range, Gann often spoke about 0/100% milestones as areas to watch. No need to be a genius, but these are previous tops and bottoms.
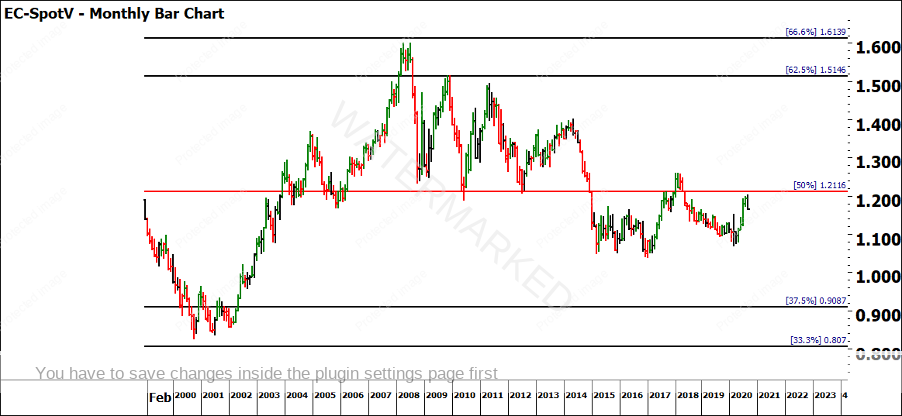
Moving onto the Primes Resistance Card, we again are very close to the 50% at 1.2116. Noticed that this price level clusters with the All-Time Ranges Resistance Card.
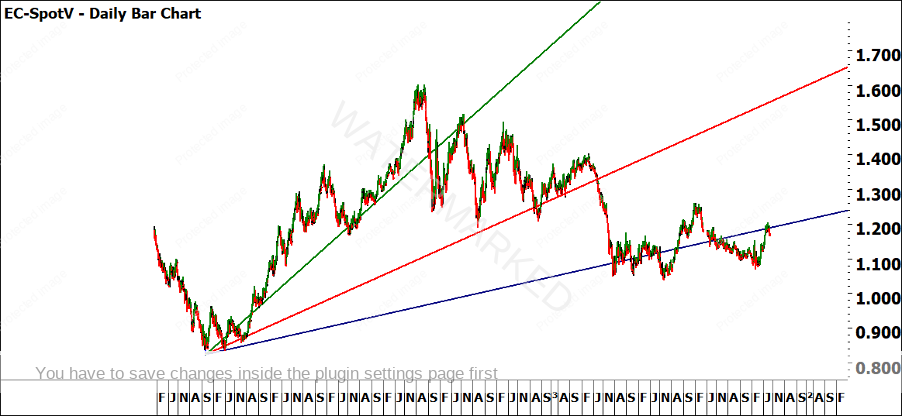
Projecting our 2×1, 1×1 and 1×2 from the ATL, you can see the market has also hit its head on the 1×2 trading day angle. If you’d like to explore the power of this angle, convert it to a calendar day angle and study the previous support and resistance levels further.
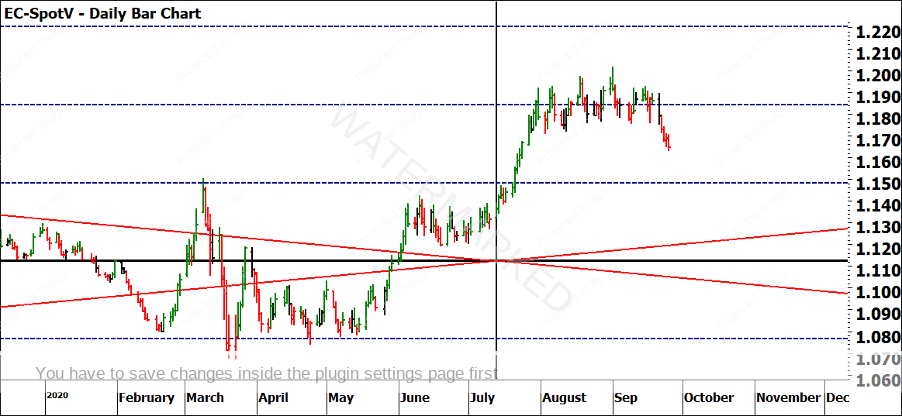
With all this analysis, where does this leave us? Jesse Livermore said, “good speculators always wait and have patience”. We have observed a number of clusters so now we need to be able to trade this. The issue amongst tops and bottoms like what we see on the daily chart below is that it looks sideways. This is why we need to be guided by the swing chart. In saying that, often when price is compressed for a period of time, it breaks out with an explosive move.
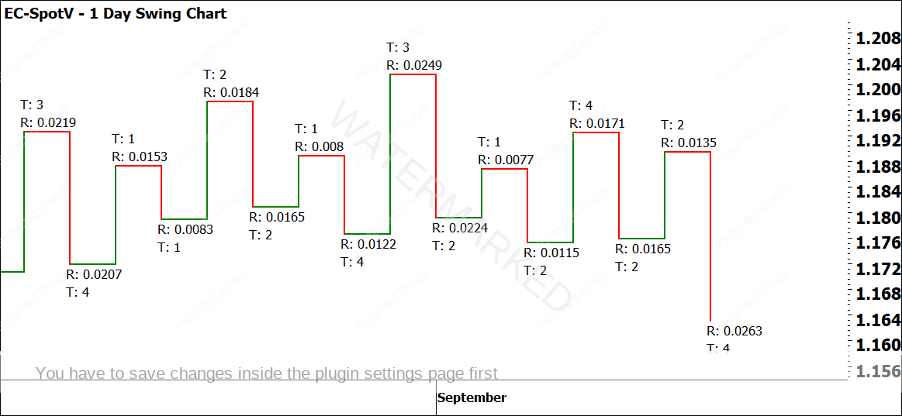
The 1 day swing chart below is current trending down. It is the first time we have seen multiple down days in a row, yet it has not given us an opportunity to enter using an ABC trade. While this is frustrating as you see the market move away without you, the question is, is this the only way to trade it and how can we be prepared for a potential move? Well, it can remain on the stalking list until ripe. Don’t forget about the 2 day, 3 day and weekly charts either.
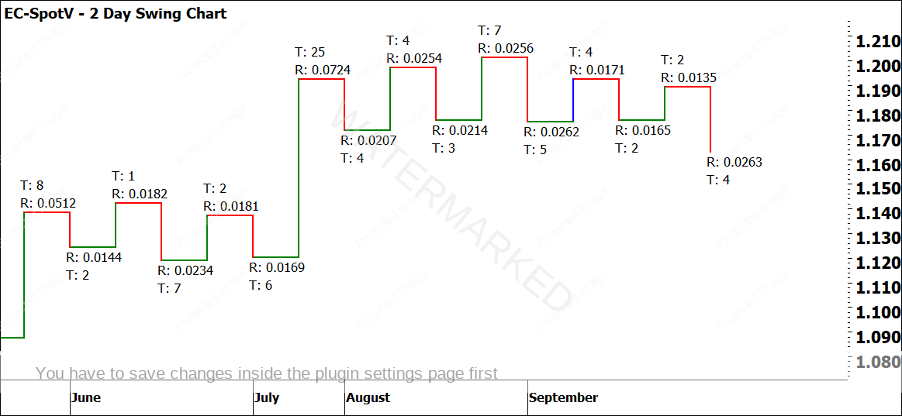
The 2 day swing chart is more clear. There are obvious swing bottoms that have been taken out, which could be classified as a breakout trade. We have also seen expanding downside and contracting upside ranges.
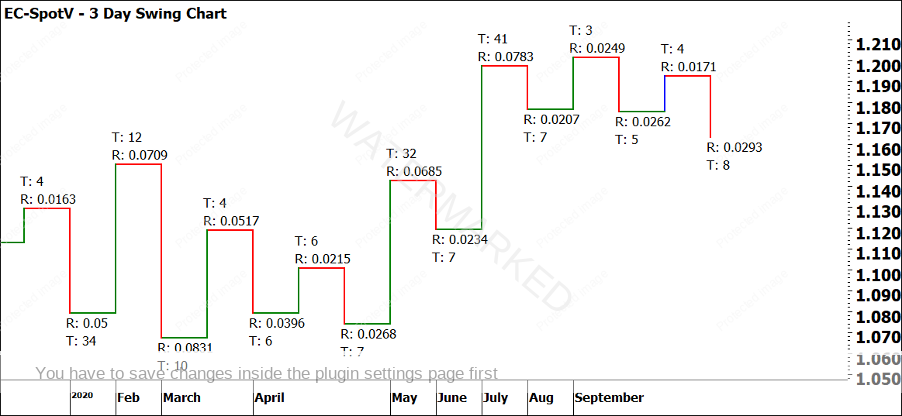
The 3 day swing chart showed a down trend as well, a little sooner than the 1 day and 2 day swing charts did. Again, we have seen expanding downside and contracting upside ranges. Could it be a 3 day swing chart that you enter the trade on?
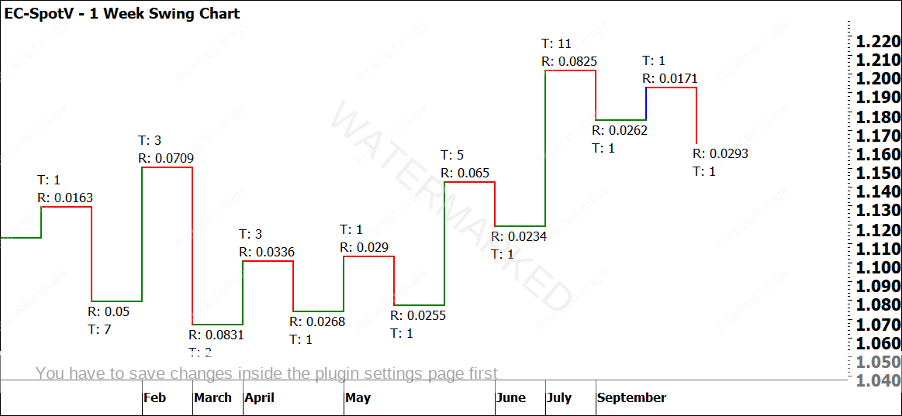
And last but not least, our weekly swing chart. This also has expanding downside ranges and contracting upside ranges. The weekly swing chart looks to be trending a lot more smoothly.
Remember, it is the trading that makes us money, rather than the time and preparation that goes into setting up a forecast. Preparing your trading execution and ‘what if’ scenarios allow you to take advantage of the next available opportunity regardless of your forecast.
It’s Your Perception
Robert Steer
