When to Change Perspective
One of the hardest aspects I found when starting out with markets was when to make changes to a plan and under what circumstances? This statement can be misleading as it suggests changing our plan is a bad thing. If 2020 has taught us anything it’s that we need to be adaptable to what is unfolding in front of us. Applying the same trading plan in the wrong environment can lead to losses and frustrations. The example I can draw most parallels with currently is sideways markets.
How long do you persevere with a trend following system when the trend is not there? Also, when is the appropriate time to change perspective i.e. time frames or swing periods to ensure you are still engaging with markets but not at the cost of your sanity and capital. This concept lends more to psychology of trading as opposed to technique but to ensure we stay on track I will cover two recent markets and my thoughts on the challenges they have provided. The trading techniques are not that hard to manage it’s the psychological management side that I want to focus on as well.
Let us take Crude Oil, a market that has had more said and written about it than most. One day it is making headlines on every news service around the globe, the next day it barely gets much coverage at all.
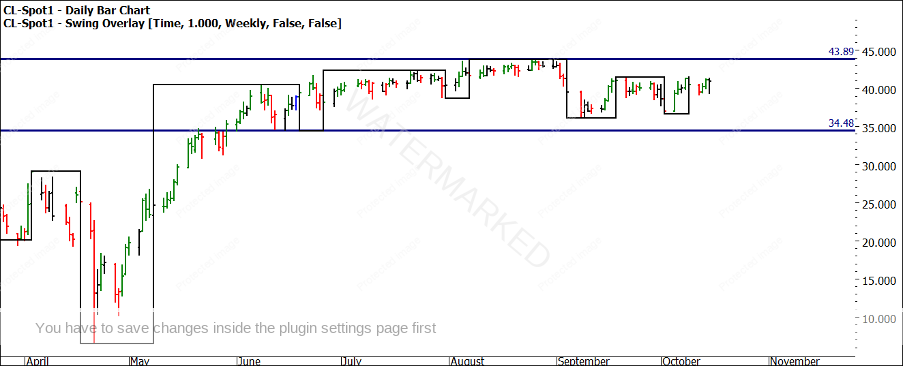
Chart 1 shows the daily Crude Oil chart with April’s low as the last major turning point. After the negative trading prices and major volatility, we have seen a very benign trading range between $34 and $44 a barrel, which sends even the most ardent trend trader back to the drawing board. At what point would changing perspective have assisted here? The simplest way to change perspective on a market is to change the time scale you are viewing the market on. If we shift our view to a wider time scale like a 2 day or even weekly swing chart, the amount of trading signals will diminish as they are stretched over a longer time frame. In the case of Oil, shifting to a wider window would not have allowed for a better way to trend trade, as the price action was simply too range bound and it did not allow for a sufficient risk and reward ratio.
Chart 1 – Daily Bar Chart Crude Oil
The second option we have is to reduce the time frames we are watching. This brings its own challenges as it requires us to speed up decision making and management of trades and for some, this is another sure way of burning up both financial capital and psychological capital. This occurs when a market forces you to adjust your plan (often after you have seen some success) and now not only are you feeling a bit lost with your method, you could have a diminished capital account to go with it.
There are other options. We could develop a strategy for trading sideways markets (there are numerous options strategies that exist for this) however this can be challenging if the market resumes trending again as soon as you have changed horses in the race.
Finally, the fourth and possibly the easiest/hardest option is to let that market go until it resumes signs of life. I am somewhat at a loss; I would not have expected I would be writing about Crude Oil being a non-productive trading market with the best option being to sit on your hands for the last few months.
For those that recall the days of seminars with me, there was always so much to bring to life with Oil. I am glad times have changed as the seminars would be quiet from the front of the room. Unless we can be comfortable to change perspective. As a student of market history, if this is my market of choice understanding what is normal and abnormal goes a long way to understanding what may be next.
The average length of a sideways period on Oil is one I have measured on a variety of scales. I have look at the periods of time where price has channelled sideways within a 5%, 10%, 15% and 25% relative price scale to the closing price of the point the market travelled sideways. The data shows that we are well outside the normal sideways period in terms of time. It typically resolves itself within 98 days of starting a sideways slumber, in the current case we are 122 days from the 15th of June 2020 where I mark the commencement of the current sideways period.
Given the current picture on many markets (outside of the tech giants) an uncertain albeit COVID-like malaise is appearing on many of the majors. Now is a perfect time to review your markets on larger time frames and look through your toolbox for systems to manage trades on say 2 day or weekly swing charts. This may not be your method for entry but for maximising the ability to hang into trades for a greater risk and reward.
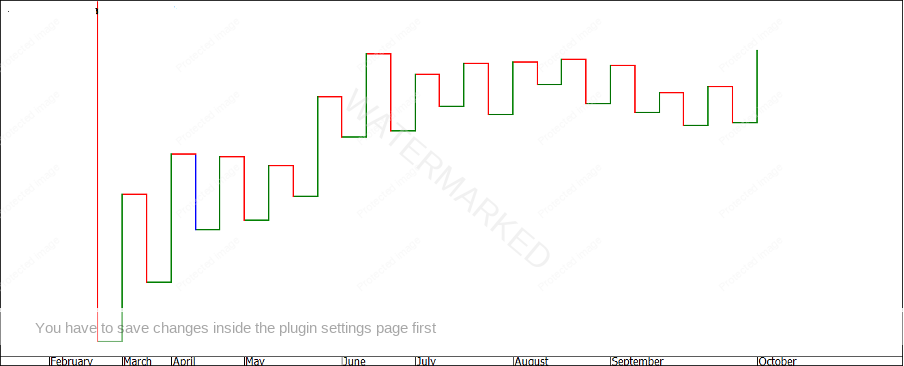
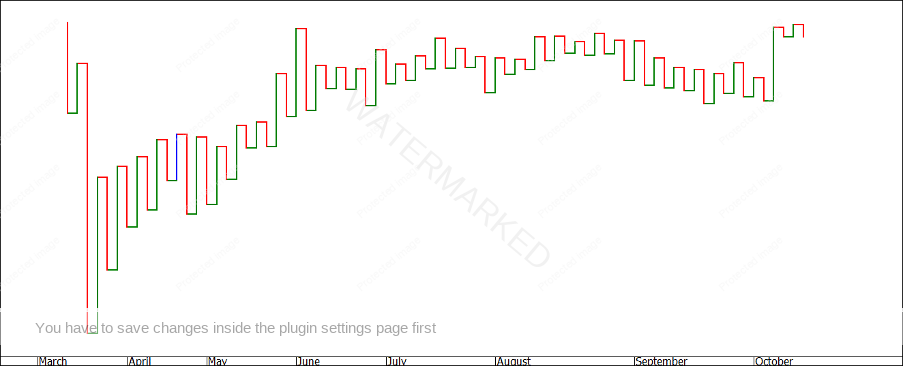
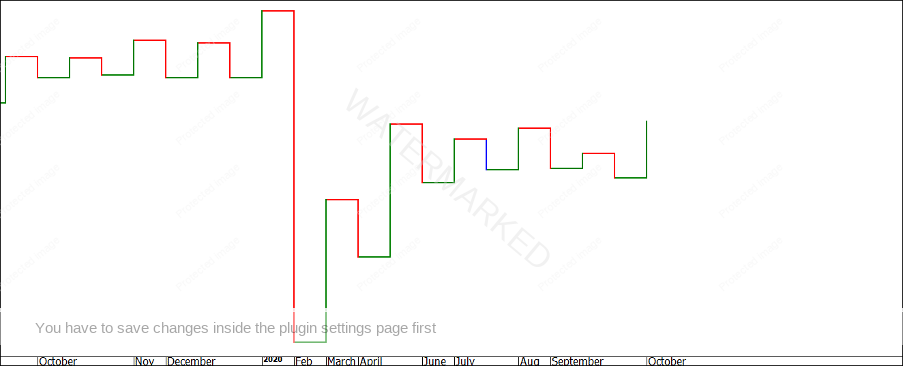
I leave you with three swing charts that highlight the value of perspective. The same market and approximate time period measured on each chart but a different swing period. If you had to pick one swing chart to make the most money off would it be A, B or C?
Chart A
Chart B
Chart C
Good Trading.
Aaron Lynch


