Actions have Reactions
With every action in the market, there is a reaction. Newton’s Third Law of Motion states that “for every action, there is an equal and opposite reaction”. The size of the reaction is equal to the size of the action. For the students who have spent time studying Gann’s sections of the market, Tubb’s Law of Proportions and Jesse Livermore’s Key, what these theories have in common is that they are comparing sections, ranges and runs of the market with another section in order to identify the strength and weakness within the position.
In many instances the reaction that occurs after an action can be compared to the previous reaction to understand the market strength or weakness, allowing us to anticipate the next phase of the market.
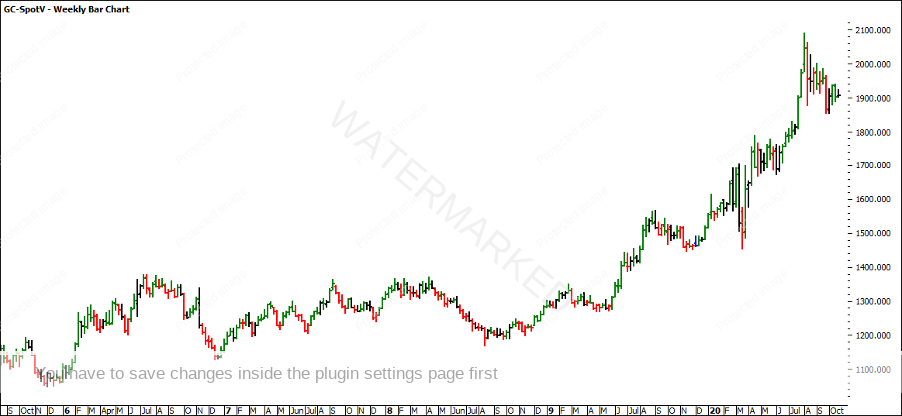
The Gold Futures chart (ProfitSource: GC-SPOTV) has seen an exceptional bull run, taking out its previous All-Time High at $1,913.5. Many speculators see the breaking of the top as a sign that Gold has hit resistance and is looking to retrace. Many questions arise in this instance, as it might only be a short-term reaction that the speculator is trading until the trend resumes again.
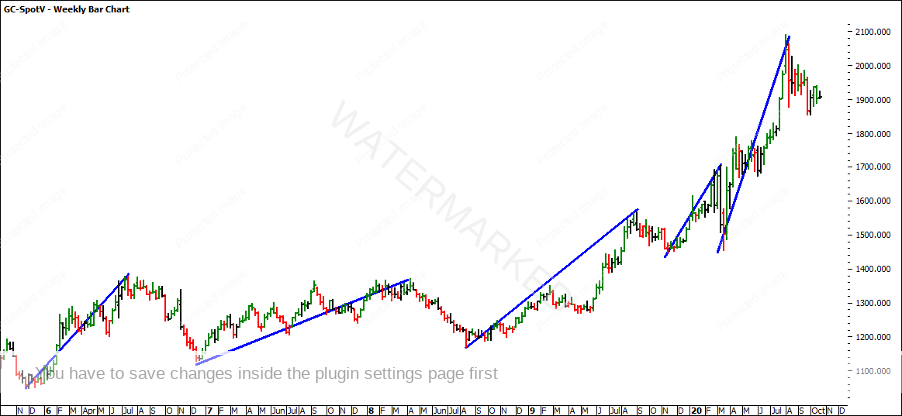
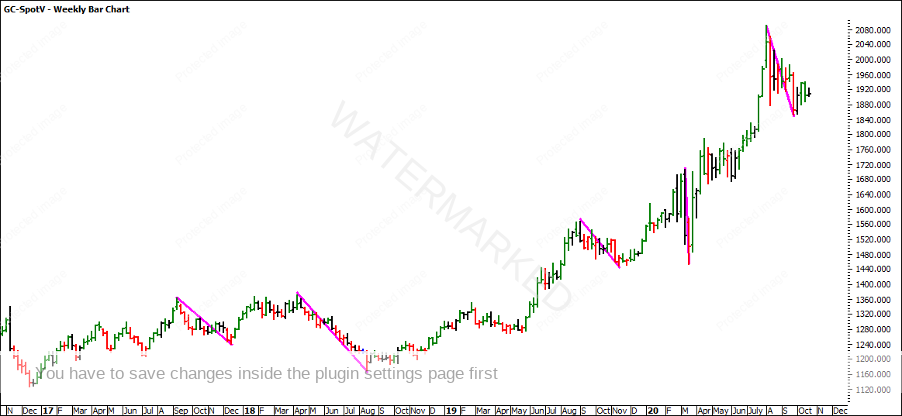
Based on the chart below there are at least five prominent sections of the market that can be identified. Whether these are accurate or not, the visual eye can identify these ‘actions’ based on the ‘reactions’ within the market. What is meant by that is that all the blue trendlines are used to identify the bull sections and the pink trendlines are used to identify the bear sections of the market.
There were five bull (blue) sections identified above, and five bear (pink) sections identified below. The art of sections and the position of the market is determined by understanding the strength and weakness of these sections.
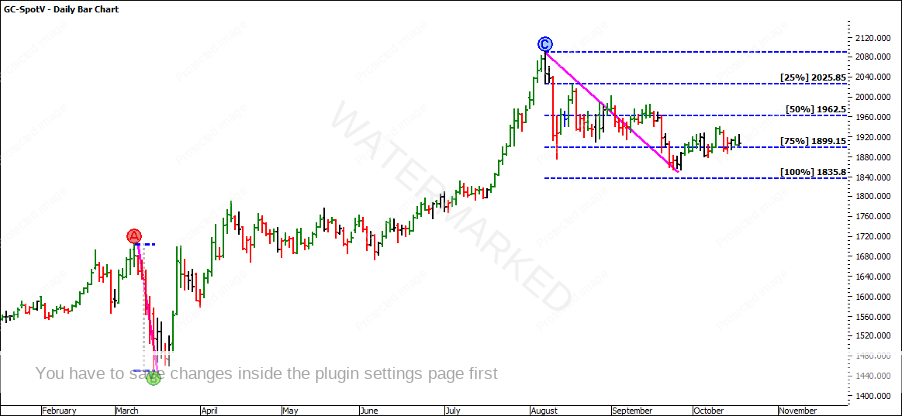
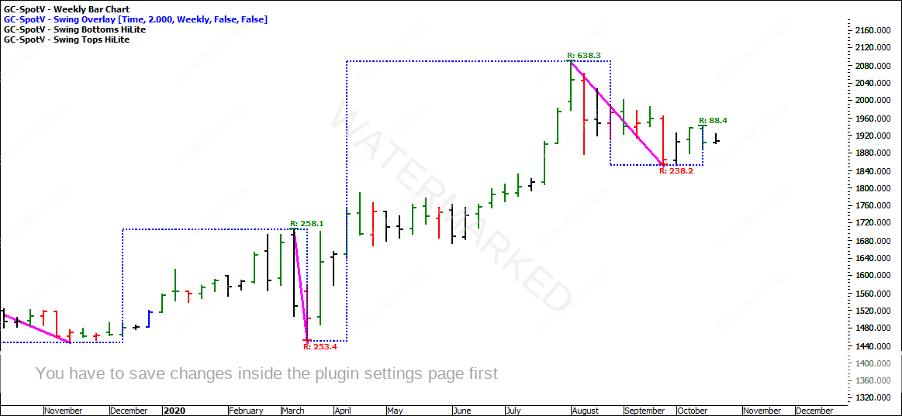
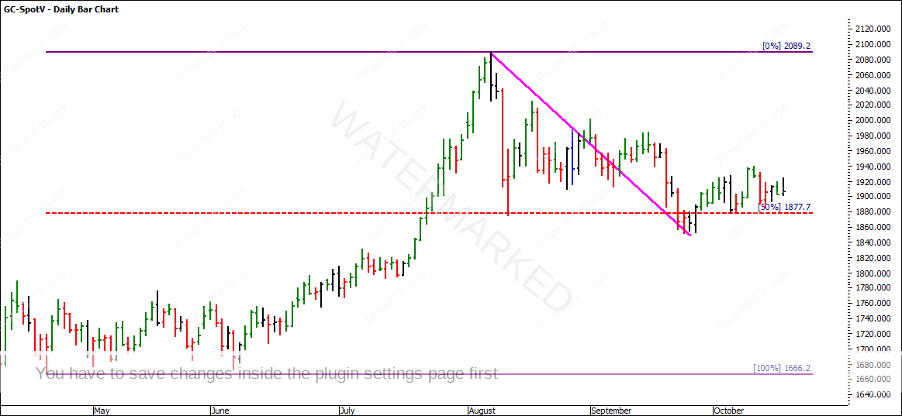
We have recently taken out the All-Time High of Gold and seen a reaction from this place in the market. Leaving everything else and focusing on the most recent reaction and comparing this to the previous reaction in March 2020, we can see that the market has not yet overbalanced this price section. We have used the ABC Pressure Point Tool and placed the AB range on the previous reaction and projected this from the current All-Time High. You can see that the market spent a lot of time around the 50% level but has not yet hit the 100% level.
Based on the reaction or pullback, price has not yet overbalanced. Based on our Safety in the Market methodology we want to wait for it to expand in order to show strength with the bears.
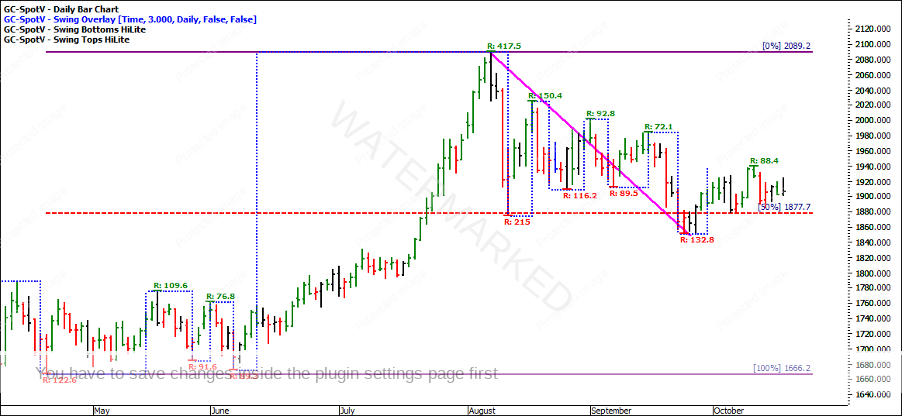
If we take this a step further and try to understand the current position of the market, we can look at this from another perspective. Applying a Range Resistance Card from the April 2020 low and All-Time High in August, the market has started hugging very closely to the 50% level. There are two obvious places where the market has reacted off the 50% level and shown signs that it has found support. Remember if this level was to break it would be likely on the fourth time through and it will also overbalance our previous pullback, giving us more confidence in shorting the market.
The three-day swing chart isn’t proving to identify a trend, though it provides clarity around the lower contracting tops and double bottom on the 50% level.
While our perception might be to short the market once we see fresh highs, it is also a time to compare the reactions within the market, as this perception shows that there is current support within the market. It might be worthy of watching for a deeper pullback and a break of the 50% level prior to shorting the current set up.
It’s Your Perception
Robert Steer
