The Power of 50% on the SPI 200
Nothing really changes with markets when we consider the challenges that are faced. How many times a year would we all like to trade to fund our desired lifestyle? If you’re trading to measure your knowledge and skills, then you may say you would like tens or hundreds of trades a year. That is fair enough, but for me after years in trading and experiencing the road and it’s bumps, my answer is now more straight forward. If I could successfully take one trade a year and generate the desired outcomes to fund my required lifestyle then that would be fine by me.
Make no mistake trading is about returns and in turn, the changes that those returns can make in your world. The diversity of what trading success looks like to people is as broad as the methods that can be used to trade markets. If we keep our focus sharp and our intent clear that profits are the benchmark of success then I feel it’s incumbent on us to look at simple things that work repeatedly rather than mastering all potential trading strategies for success.
If I think back to the simplest ideas of forecasting and patterns in charts, the 50% from Gann and the pattern of double bottoms or double tops would be in the easier to digest and understand category. We all know consuming Gann’s writings can be tedious given his style. I recall when he wrote that the 50% rule was all you needed to make a fortune. When David wrote about double tops and bottoms this also resonated as a pattern that did not require x-ray vision to see. If we can combine the two successfully then we can increase profits and potentially reduce trading frequency.
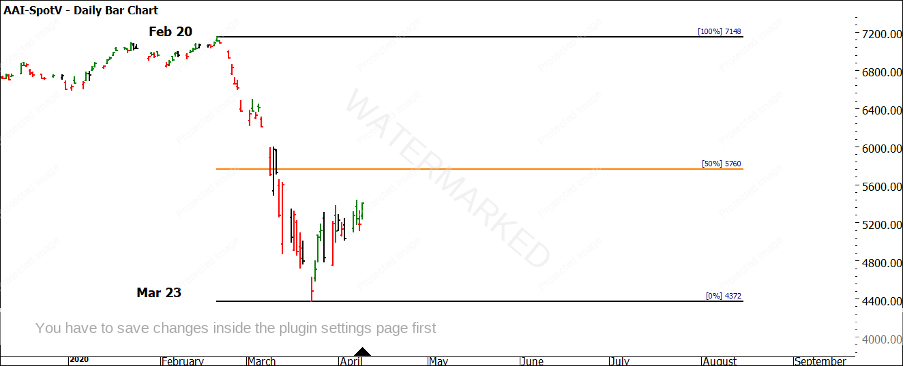
In Chart 1 we return to the SPI 200, the market where it clicked for David. 2020 has delivered volatility for many markets and we saw index futures take a tumble in February as the potential of COVID 19 spooked markets. That range from the February top to March low gives us an important range.
Chart 1 – Daily Bar Chart SPI 200
Focusing on this range and then setting back and waiting for a setup as mentioned above requires a little to a lot of patience. Double top/bottom patterns on50% patterns can mean sitting on your hands waiting for a signal. A reminder that profit is the benchmark of success, so sometimes it is in our interests to be patient.
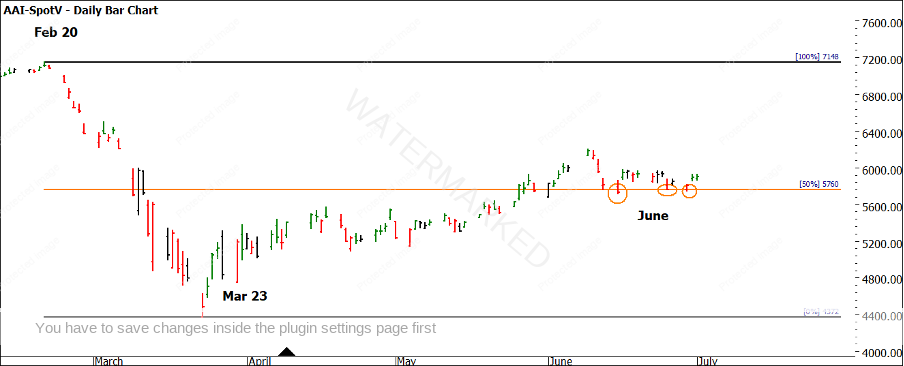
We see the price of 5760 as being the 50% point of this range so we can watch and see how this develops. By the middle of June, we see in Chart 2 how the price action has broken above the 50% level and it has used 5760 as a level of support. The pattern some may argue looks like a double or triple bottom (loosely). I might disagree somewhat as my preference for double top/bottom patterns is for them to exhibit a level of volatility in them so a potential springboard effect can occur. If the pattern is sideways and narrow you may not get a strong reaction.
Chart 2 – Daily Bar Chart SPI 200
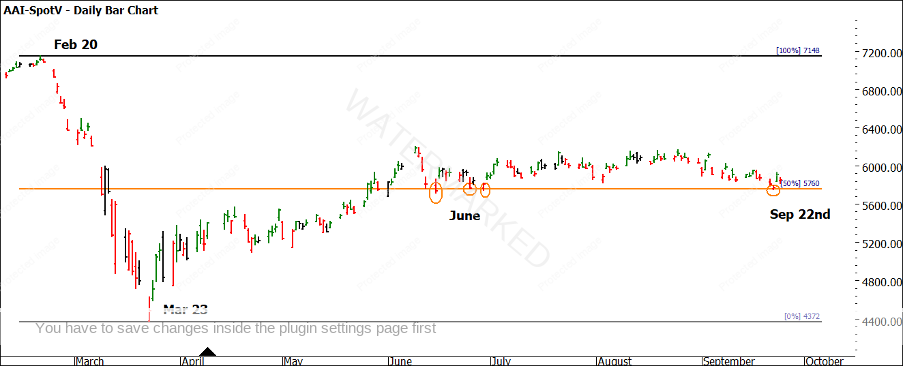
The positive in this price action through June is that the market is viewing the 50% area as important. In Chart 3 we see how the price action has moved mainly sideways and the next time the price action touches 5760 is on 22 September 2020, once again acting as support.
Chart 3 – Daily Bar Chart SPI 200
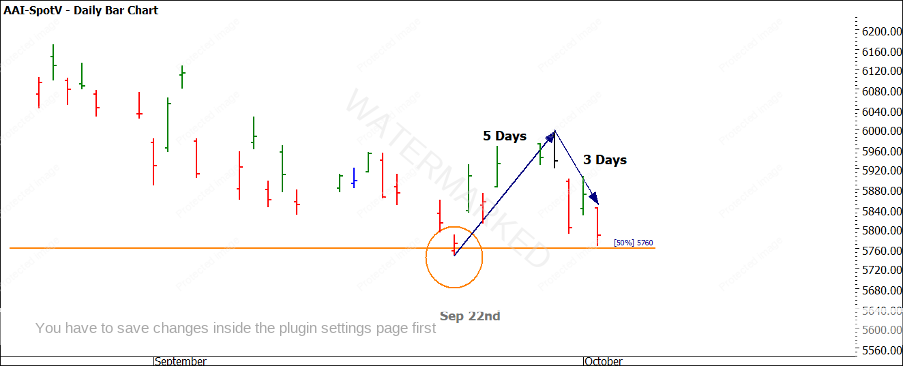
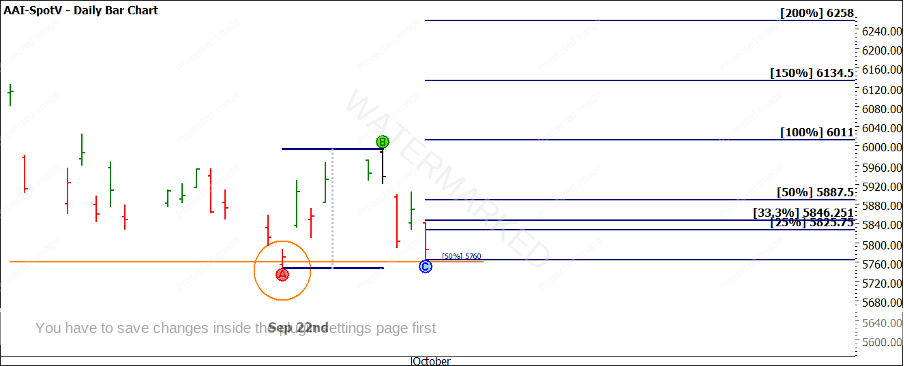
In Chart 4 we see the price action has pushed out from the 5760 level and then come back and pulled up 4 points short of the 50% level on October 2nd. There is much more to look at in terms of time, we are 180 degrees from the March low and there are also some anniversaries we could tie into the chance for a change in trend. When reviewing double top and double bottom patterns I always analyse the symmetry of the up and down days, in this case its 5 trading days up and 3 down. The close pattern on the bar for 2nd October is also trading in the lower range of the bar so we can be on alert based on the next day’s sentiment.
Chart 4 – Daily Bar Chart SPI 200
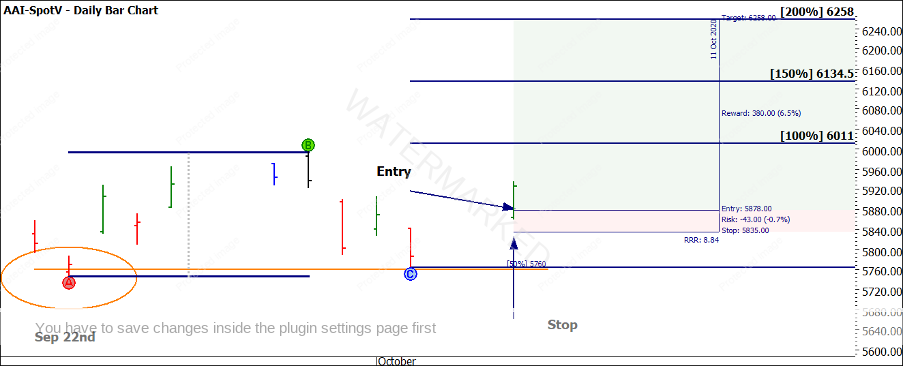
The margin on the SPI futures these days does require consideration in terms of what capital is required to trade this market, however, there are multiple options with other instruments like CFDs you may consider accessing as a starting point. Chart 5 gives some price targets to look at the 200% as per David’s lessons. The normal entry inside limits is somewhat tight if applying an ABC style entry theory. In cases like this, a more advanced entry and stop management may be required.
Chart 5 – Daily Bar Chart SPI 200
Chart 6 shows the Monday trade with the SPI gapping up on open, using the openers rule with stops behind the gap we can manage the risk to reward ratio. The risk in this scenario ended up being 43 points @$25 a point, which saw us risking AUD$1075 per contract.
Chart 6 – Daily Bar Chart SPI 200
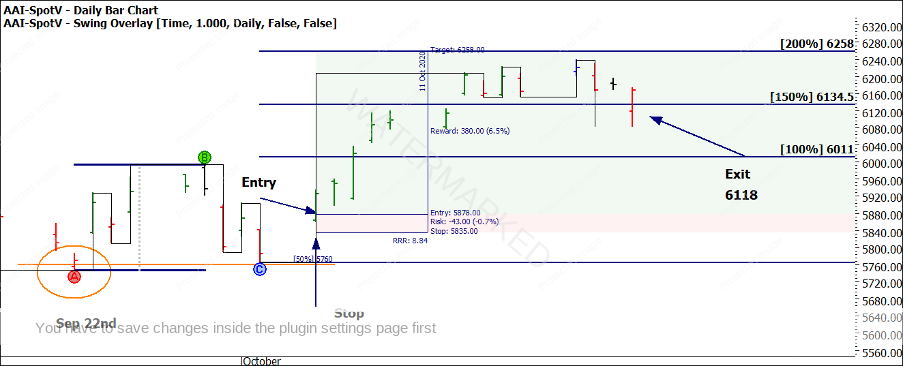
The trade progressed well in the initial stages as we can see in Chart 7, with the first week of the trade pushing close to the 200% target (falling approx. 20 points short). The trade can be managed multiple ways to either keep stops close or allow the trade to breathe.
In this case, trailing stops behind swing bottoms saw the trade exited on the 22nd October at the open @ 6118 a profit of 240 points. (6118 – 5878)
Chart 7 – Daily Bar Chart SPI 200
The trade showed patience and the value of 50% pressure points and reliable patterns like double tops and bottoms. The profit at $6,000 per contract against the risk shows an approx. 5.5 to 1 reward to risk ratio.
The value of this analysis might be only used once a year on your market of choice but when used well can be a strong method to build the trading account.
Good Trading
Aaron Lynch
