The Right Side of the Line?
When the market offers us clear patterns where support and resistance meet or better still show a clear space of disagreement where bulls and bears fear to tread, we can often be comforted on which side of the line we want to be and in turn help us tune our direction of trades be it long or short.
An example of such a line is currently in play with BHP, listed in the ASX market, and offers us some insights into understanding big picture turns. Another useful aid in the current picture is the use of gaps to define bull and bear pain points. Gaps are never fun when you are on the wrong side of them, but great when they work in your favour and are based on volatility in markets, which we have recently seen, and should not have surprised you given a US election. This is further heightened by the fact that this is the election given the perceived importance of the outcome and the fanfare that has surrounded it.
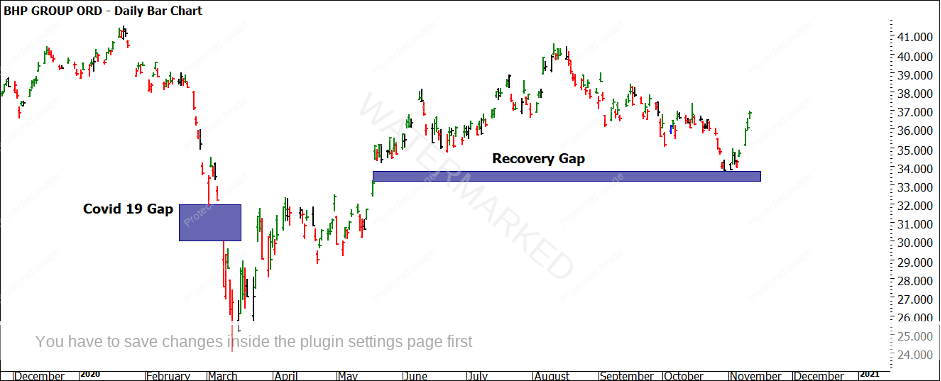
In Chart 1 we see the gap that is in play. There are two gaps we can focus on, the COVID-19 gap down that was in Q1 and the more important gap that has held from May to now. To understand how gaps behave, it’s important to research them. We can create general rules, but market specific observations are much better. Questions like how quickly it usually takes for a market to close the gap, are important insights.
The importance of the May to June gap is in context of the bigger picture where the bears have failed to take the price through the gap. Whilst this remains, the option of being short below the gap makes sense and long above (in line with your trading rules) holds. It was valuable to me to see the market attempt to retest the gap but fail to do so.
Chart 1 – Daily Bar Chart BHP
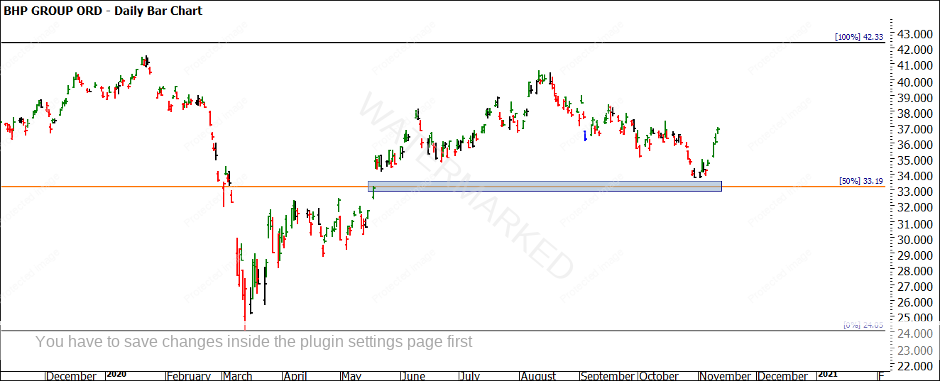
Chart 2 allows us to align Price Forecasting levels from the Number One Trading Plan to test how important the area may be.
We see how the 50% point sits in the approximate gap; this reinforces the importance of this area.
Chart 2 – Daily Bar Chart BHP
Your job here is to look at other price-based techniques here that could be overlayed in the $33 zone to back up this analysis. Always start on the big picture first.
A hint would be the 2016 low of $13.48. How many multiples of that price take us around $33?
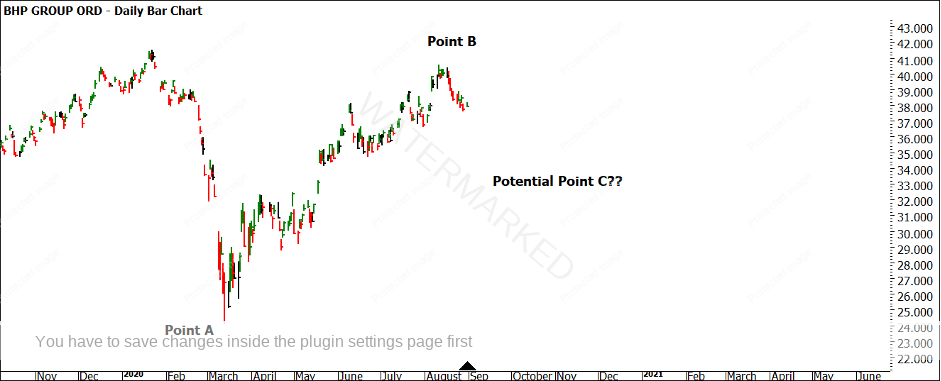
Given we are hunting big picture turning points to maximise our reward to risk ratio, we could have seen 2020 as a large ABC trade with patience and research required to understand where that potential Point C may come in.
Chart 3 – Daily Bar Chart BHP
As we rate the strength of Point C in price, we can look at other pointers to understand where a “classic” Point C would come in. Chart 2 shows us the textbook use of the 50% level, even better when the price action pulls up subtlety before the 50% (with the aid of a gap) as it’s signalling to us that the bulls are impatient to allow the market to balance and want to get on with the next leg potentially.
If we rate the A to B range in price we can also do so in the other dimensions of time and the third dimension.
The run from A to B in time was 151 days up and 80 days down which gives us a loose 50% retracement in time.
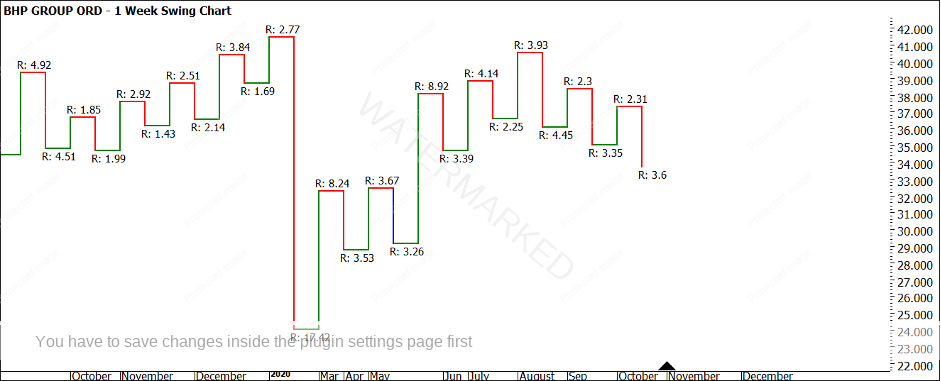
If we zoom into the small picture, the market gave us some signs around the election of the harmony in the weekly swings with ranges repeating and familiar numbers popping up.
Chart 4 – Weekly Swing Chart BHP
If we could combine a low-risk entry technique, we could potentially see a return.
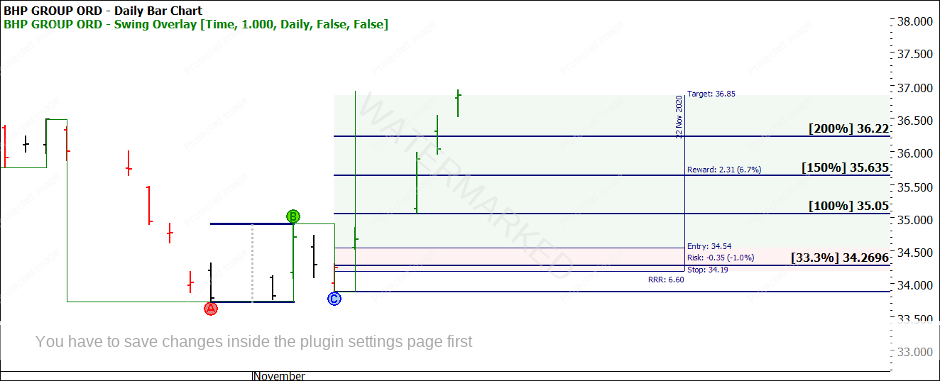
Chart 5 follows the potential set up of a first higher swing bottom on the daily chart for confirmation of entry. There were potentially other methods to enter, but we will follow Gann’s principle of safest place to buy being the first higher swing bottom off support.
The low came in on the 30th October with several days’ patience required to stalk the entry, this arrived on the 6th October. Note the entry was outside standard limits but was mitigated by placing stops behind the gap.
Chart 5 – Daily Bar Chart BHP
Since entry, the market has skipped away and based on the close of the last bar a reward to risk ratio of 6 to 1 is in play. The potential to manage this setup further is on the cards but these types of big picture entries are worth the patience for the market to develop them. The basis of this scenario comes from some gaps and 50% points with a developed entry strategy to manage risk. Not all setups need to utilise all the tools in the toolbox.
Good Trading
Aaron Lynch
