I SPI Strength or Weakness?
Welcome to the November Platinum Article. Rating the strength or weakness of a market is a concept first introduced in the Smarter Starter Pack where David gets us drawing on our estimated Point C for an ABC trade. If the market retraces less than 50%, the market can be rated as strong and if it retraces more than 50%, the market can be rated as weak.
What other tools can we use to rate the strength or weakness of a market? Expanding A-B ranges and contracting B-C ranges in time and price is one that comes to mind as do 1×1 angles. If the market holds above a 1×1 it’s stronger and if it falls below its weaker. With the above handful of techniques on rating strength and weakness, I can continue my analysis on the SPI and rate the 2 November low and the run-up out of it.
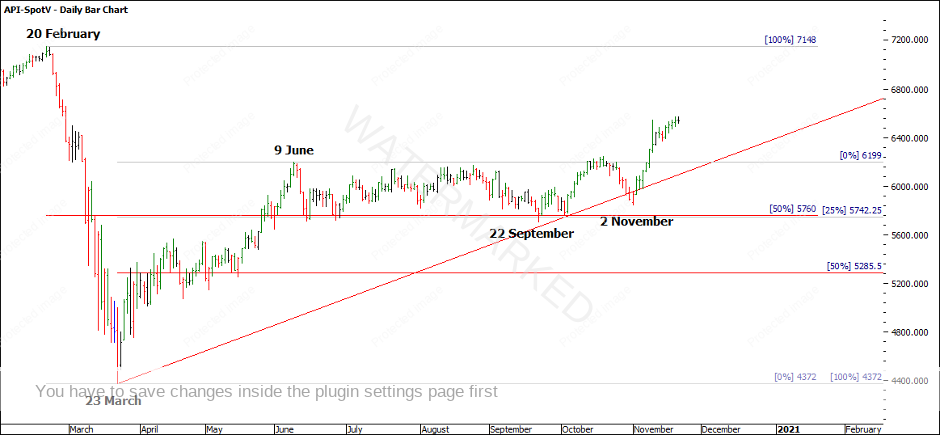
Looking at Chart 1 and the yearly picture of the SPI, the 2 November low came in above both 50% retracements and the 22 September low came in on the 25% retracement of the March to June run-up which has now become our new monthly higher swing bottom. We also see the SPI still trading above a 1×1 trading day angle from the March low. So for me, the bigger picture is still showing strength to the upside.
Chart 1 – SPI Daily Bar Chart
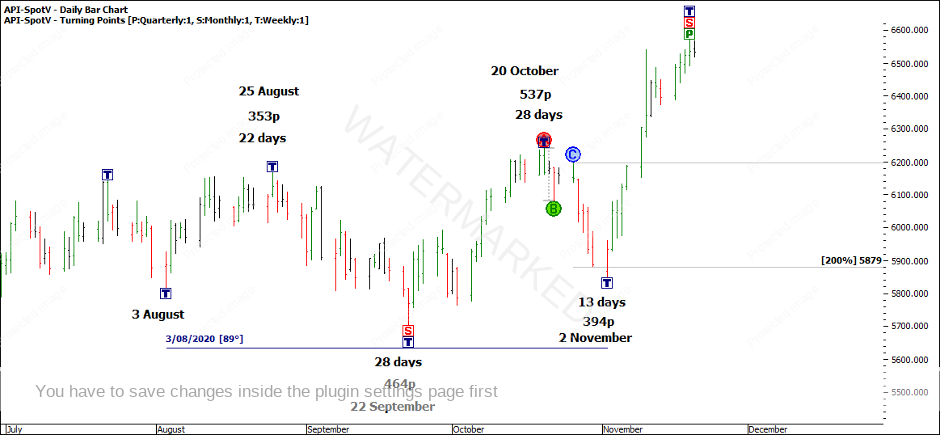
Having a closer look at the action, could you have called the 2 November low and traded it? As you can see in Chart 2, the 2 November was a signal day on the 200% milestone of the daily swing chart, and 90 degrees from the 3 August low. However, the weekly retracement in price was more than 50% and doesn’t get the tick for strength. It is worth looking at the weekly time and price ranges. There was an expanding weekly upswing of 537 points followed by a contracting weekly downswing of 394 points, which is our expanding A-B and contracting B-C range out of the Smarter Starter Pack. I would then look at time 28 days up then 13 days down, less than 50% time retracement.
Chart 2 – SPI Daily Bar Chart
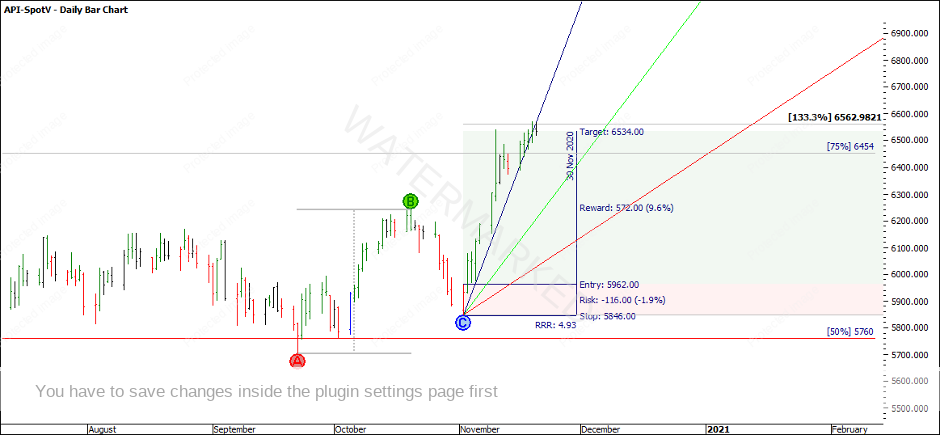
If you were watching this and wanted to trade it, entering as the daily swing chart turns up has proved to be a good entry strategy as the close of 20 November has the trade near to a 5:1 RRR. For one full contract at $25 per point the initial risk for this trade would be 116 points x $25 = $2,900 with a current profit of 572 points x 25 = $14,300. Although if you are trading the mini contract at $5 per point the risk on this trade would be, 116 points x $5 = $580 per contract with a current profit of 572 points x $5 = $2,860.
Chart 3 – SPI Daily Bar Chart
Back to rating the strength of this weekly move, 133% of the previous weekly swing range is an expanding range and a sign of strength and Gann tells us to watch for another section. This weekly run-up has also been running at a 4×1 geometric angle from the 2 November low which is a strong pitch and one we really haven’t seen since the run out of the 23 March low. Also, the SPI has just crossed through the 75% milestone of the February to March range.
So what should we expect now and how might we manage this trade? Well with a few of the above techniques indicating strength, plus the fact that the market is still in the Summer of the monthly trend I will keep a bias towards long trade opportunities until either a strong cluster is hit or something changes.
I’ve found with my own trading that trade management can often give the most amount of anxiety. Watching a profit grow, knowing which stop management strategy to employ and when to take the profit. This is personal and really depends on your own ‘style’ of trading, what you can handle and your trading goals. It’s worth going over plenty of market history and trading statements to really understand what works for you.
Happy trading,
Gus Hingeley


