Golden Time of the Year
It’s been a year to remember, that’s for sure! While 2020 might have shown us some exciting moves, the media sure liked stirring news around and speculation of a potential investment recession that never hit the Australian economy. This year was another classic example of the media using guesswork. Regardless of the ups and downs of the year, we have come to complete another annual cycle, which means the start of a fresh year of 2021. It always sparks interest for new opportunities, especially to those who have spent the time doing their homework over the festive break.
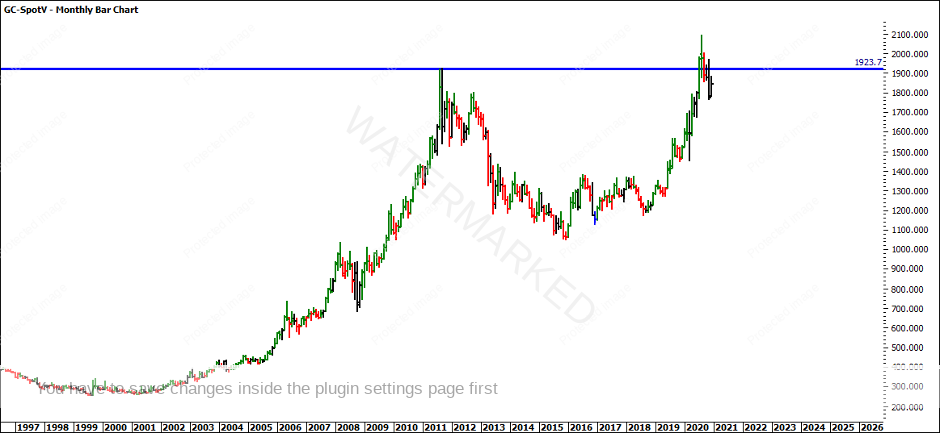
Being a Golden Time of the Year to start planning for 2021, it might be worth reviewing Gold (ProfitSource: GC-SPOTV). Gold made a new All-Time High close to the August Seasonal Date – 7 August 2020 at 2089.20. It broke through the previous 2011 high on the 6th of September at 1923.7. We have since fallen back below the previous 2011 high.
Looking at the monthly chart, there is currently an uptrend in play.
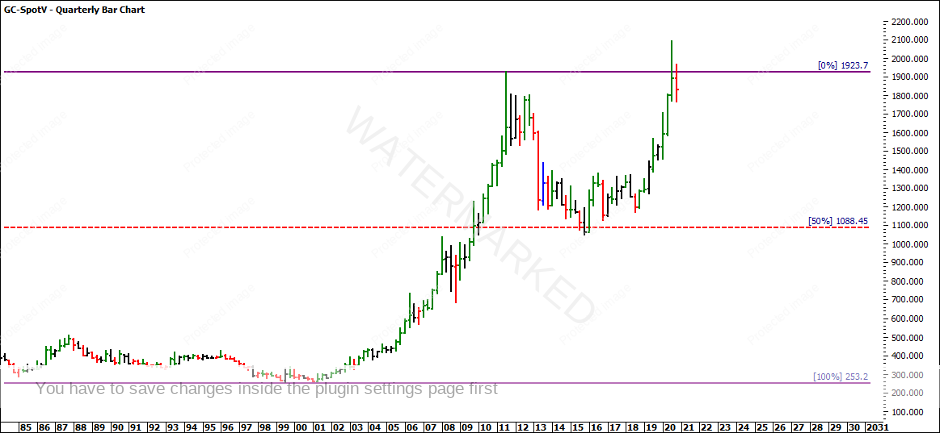
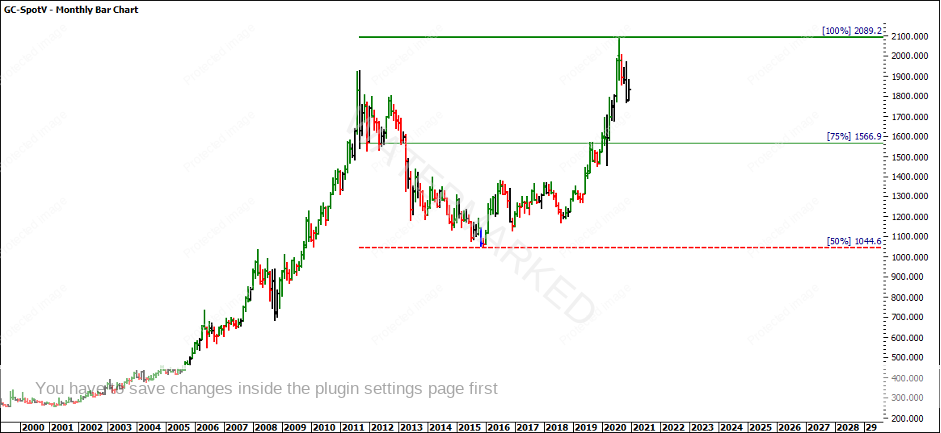
Taking a step back in time and reviewing the 1999 – 2011 Ranges Resistance Card, you can see that the market came and found support on the 50% level. The low came in on the 3rd of December 2015 at 1045.4. What is interesting is if you multiply 1045.4 by a factor of two it equates to 2090.8. The new All-Time High is 2089.2 which is close to two multiples of the 2015 low. Gann often mentioned that lows call the high.
If you project the Highs Resistance Card from the new 2020 All-Time High of 2089.2 you can see this effect. This makes this a worthy chart to be following in the future. It is also good to see that the 75% level has acted as both support and resistance to the market previously. These levels become higher probability pressure points to watch for in the future, particularly if the swing chart ranges cluster around them.
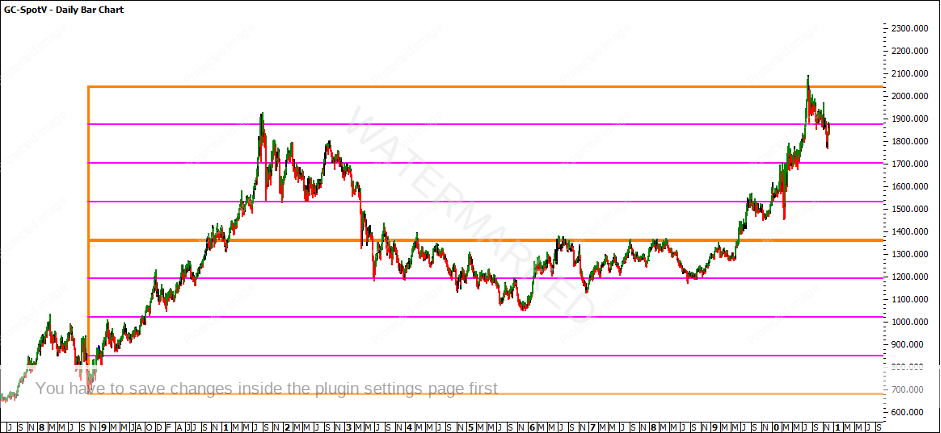
Projecting a Lows Resistance Card from the 2009 low of 681, you can see in the chart below that three multiples of this low equates to 2043. The market broke through this level but was only able to close above it once on the weekly chart before it pulled back under. It is another resistance card worth keeping an eye on as it was two multiples of 681 at 1362 that the market kept hitting its head-on before it shot through.
If we turn to the current position of the market, we have seen Gold come back to 50% of the November 2019 low to the recent All-Time High. What is interesting is that the monthly swing chart is currently up, as per the chart above. If you also noticed the 50% level had previously held the market up between April – June 2020 and from the looks of things, the old tops have become new bottoms.
The 1999 Lows Resistance Card also shows some support at the current level. The 1999 low was at 253.2 and currently seven multiples of this low are acting as support for the market.
The First Range Out projected also sees the market come back to the 200% level which is currently acting as support. Previously in 2011 and 2012 the market found loads of resistance at the 1800 level. More recently this resistance level has started to act as support for the market.
As the market has pulled back from the All-Time High, it has started to find support levels. The 2-Day Swing Chart identifies a potential overbalance in price trade, where the upside range of 117 is more than two multiples of the previous range of 44.1. This doesn’t mean that you should go out and buy Gold, however it means there is some opportunity to watch the market.
The next opportunity is always around the corner. While you might have missed the 2020 bull run on Gold, if you spend the time reviewing the current position there might be some future opportunities just around the corner. Learn the concepts from this year’s articles and apply them to your chosen market.
Wishing all the Safety in the Market family a safe and enjoyable holiday season and a prosperous 2021!
It’s Your Perception
Robert Steer


