Right On Time
Welcome to the Platinum discussions for 2021, I hope you enjoyed the festive and New Year’s period, as we collectively enter the new year with hopes for a brighter and better year than the last. I am sure by now you have undertaken a review of last year’s trading outcomes and looked at a workable and achievable plan for this year. If you have not, it may be time to revisit that, as I find without a defined framework of what I want to achieve this year, the year… and the results we crave… may slip away all too quickly.
If we review last year overall, I personally looked at less markets and was a bit more patient for setups, I also enjoyed the volatility of the markets (which we need). The backdrop of lockdowns, working from home and having extra people in the house i.e., kids added to challenge, but I felt that if I could manage with the external pressures of last year, then whatever we have thrown at us in 2021 we at least have some experience at pivoting and adjusting.
As many of you know, I primarily focus on the oil market and it has undergone serious changes in the time I have been following it. We are constantly reminded of the potential for new energy sources as the climate change debate rages on, could we see a major shift in the need for oil if technology and innovation provide new ways for us to power vehicles? The other major impact in 2020 was the major decline in the use of oil as we had less cars on the road and very importantly a major decline of aircraft in the air (as a former pilot I can say I am happy I made a career change a long time ago). This in turn delivered a predominately sideways market for many months as I wrote about. It was frustrating and I sought out other opportunities, however, the trade of the year did eventuate and was a pretty standard setup from my playbook as long as I had eyes on the prize.
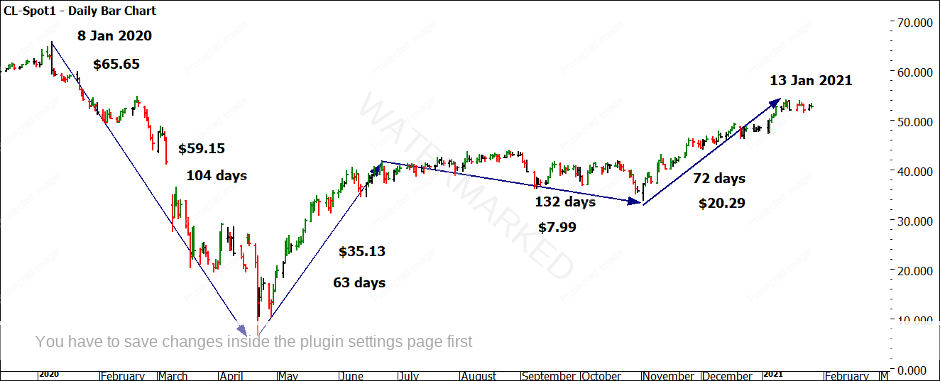
Chart 1 below shows the shape of the market in 2020 with the most notable period the sideways movement that extended to 132 days. From historical analysis, the average sideways period is approximately half that number, so this certainly can be considered abnormal.
Chart 1 – Daily Bar Chart Crude Oil 2020
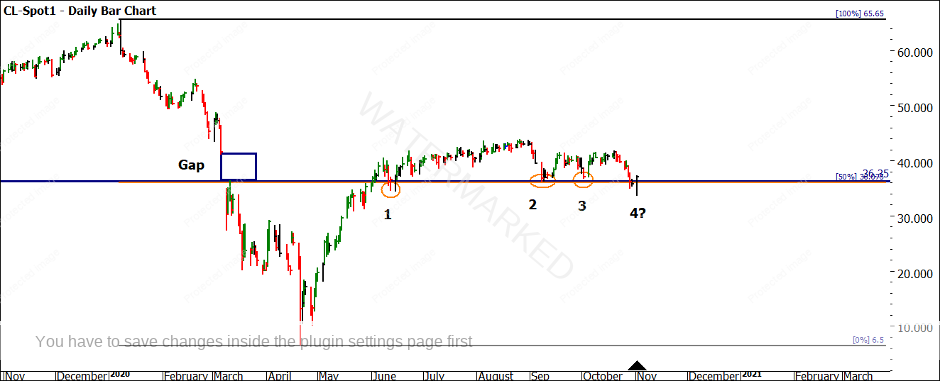
The general patterns of time and price ranges warrants some further analysis in terms of the numbers themselves as they do exhibit some known harmonies. As we see in Chart 2, there are some price-related levels of interest. The gap that occurred in March 2020 is interesting as gaps are relatively rare on the continuous charts for Crude Oil. As we know, gaps can act as support and resistance and the lower side of the gap at $36.36 is a level to watch in combination with the 50% point on the ranges card from January to April 2020 at $36.08. Once the market decided to trend again, I was looking for this level to act as either support or resistance.
The market tested this level and held support marked at 1, 2 and 3. Using Gann’s idea that a market will go through a level on the fourth attempt, we saw the opposite. The price action reversed strongly out of the early November 2020 low.
Chart 2 – Daily Bar Chart Crude Oil
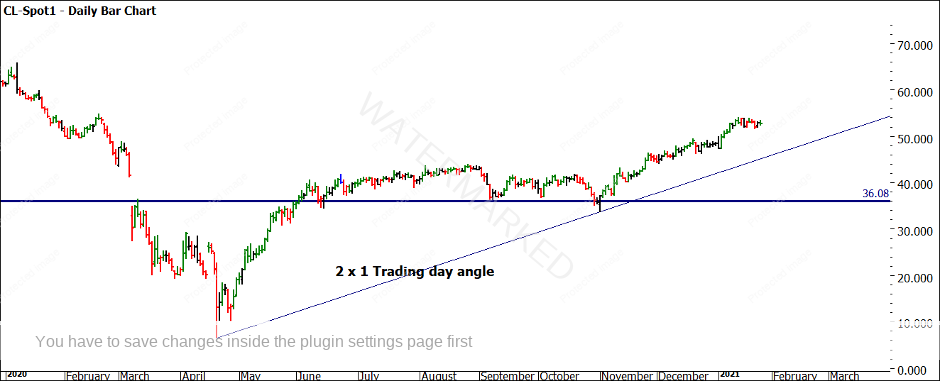
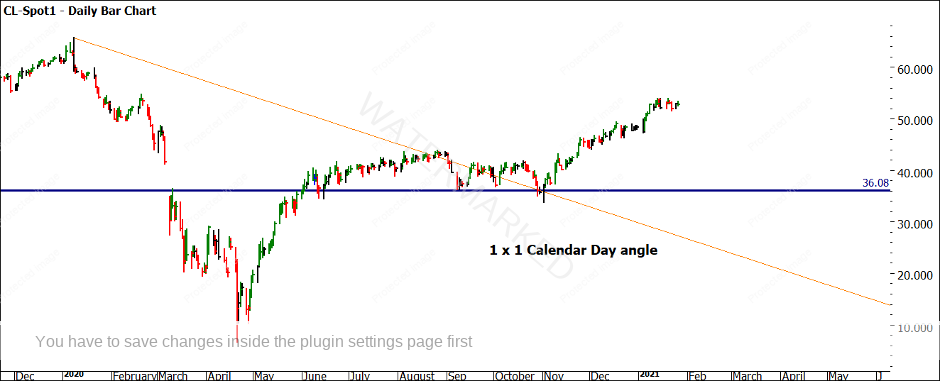
Charts 3 and 4 utilise some 3rd Dimension studies as we look at angles of the 2020 lows and high to identify if there is any support around the November low.
Chart 3 – Daily Bar Chart Crude Oil Trading Day Angle
Chart 4 – Daily Bar Chart Crude Oil Calendar Day Angle
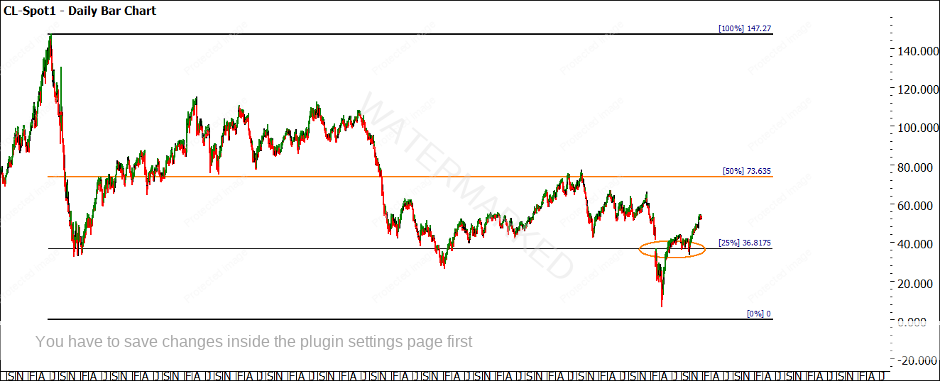
Chart 5 offers us some big picture price work with All-Time Highs Resistance Card suggesting a price target of $36.81 as being significant.
Chart 5 – Daily Bar Chart Crude
There are several other time and price pressure harmonies you can combine to strengthen the view that the November low was one of interest. That can be your task, to gather as much evidence for that low as you can in all three dimensions of analysis.
We can now focus on the important aspects of trading which is where analysis becomes action, and we look to capitalise on the setup we have identified. Take note, 2021 will be no different than any other year of markets where the trading plan and management of trades will be what rewards you most.
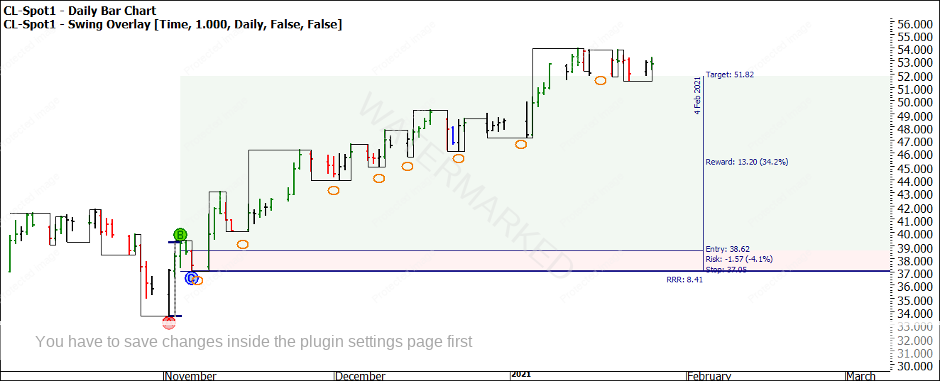
It’s rare in the oil market to have a 1-day swing chart trailing stop model produce a way to hold for a long run as the volatility often causes stops to be triggered. In this case, the market showed a reduced level of volatility as signalled by the average range indicator and allowed for confidence to maintain a trailing stop on a 1-day chart. A 2-day swing chart would have produced excellent results which is my preference in higher volatility environments.
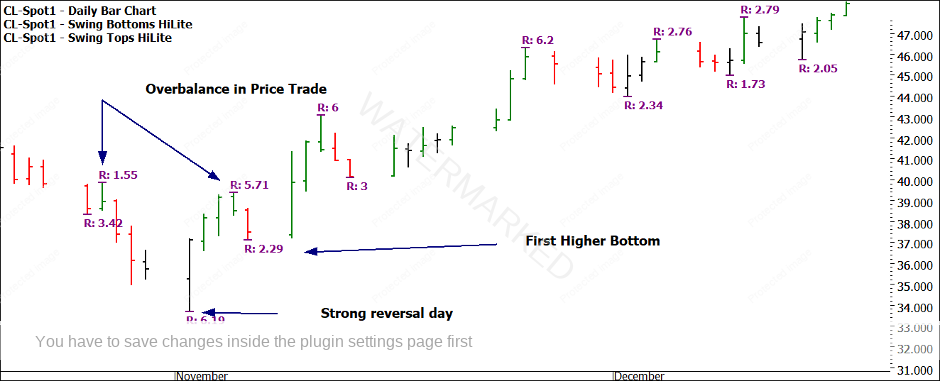
The actual entry was based around an Overbalance in Price ABC setup which is one of my favourites. The ranges told the story in and out of the low and a first higher bottom entry was sufficient.
Chart 6 – Daily Bar Chart Crude
Chart 7 shows the use of stops below swings, and the trailing method allowing for a reward to risk ratio of over 8 to 1. In basic numbers, a risk of USD$1,570 per contract delivered a potential profit of USD$13,200 per contract. As we know, it only takes a few good trades a year on your market to underpin your trading business.
Chart 7 – Daily Bar Chart Crude
The next question is of course where to from here? Well, we can expect oil to continue to be the focus of the globe as we define the next decade of energy use and needs. We can also expect that wars, geopolitical tensions and general economic conditions will be attached to oil as it is kicked around like a football. All I hope for this year is no 132 day sideway periods, but if that happens again, I can be sure whenever the trend breaks as long as I am on the ball the opportunities will be available.
Good Trading
Aaron Lynch
