The Queen’s Gambit of Trading
Hello and welcome to the January edition of the Platinum Newsletter. It’s great to be back after a break, ready to tackle the markets and this year’s research projects.
‘The Queen’s Gambit’ on Netflix was a great series. It reminded me of the intense study required to be great at anything. David Bowden said that he did “ordinary things, extraordinarily well” which was part of his secret to success.
As I was revisiting reading concepts from Chapter 2 – Key Form Reading Concepts of the Ultimate Gann Course manual, I picked up on a few new things that my brain hadn’t previously recognised and that I’m sure weren’t there earlier. The beauty of having course material is being able to go over it again and again and again.
Chapter 2 is a dense chapter. It covers time counts, balancing time, chart patterns, double tops and bottoms, accumulation and distribution, false breaks, signal tops and bottoms, position of the market and speed angles. David also mentions that a strong market will do two-day reversals or less, while also discussing cycles and rating strength and weakness. If all you did this year was revisit that chapter and applied it to the market of your choice, it would be time well spent.
A key concept out of this chapter is ‘Chart Setup’ on page 26. The picture sums up what the whole chapter is about. A great statement by David, on page 17 of the Ultimate Gann Course manual says;
“If, in a time frame, a stock or contract has the same price range as in its previous run, the market can be said to be in balance. If it has travelled less than that price range it is weak and a repeat is unlikely. Conversely, if it has exceeded the price range it can be expected to resume the trend, after it has had its time correction. The above paragraphs represent the best way of both trading and forecasting that I have been able to come up with in the last twenty odd years of being deeply involved with every aspect of the markets”
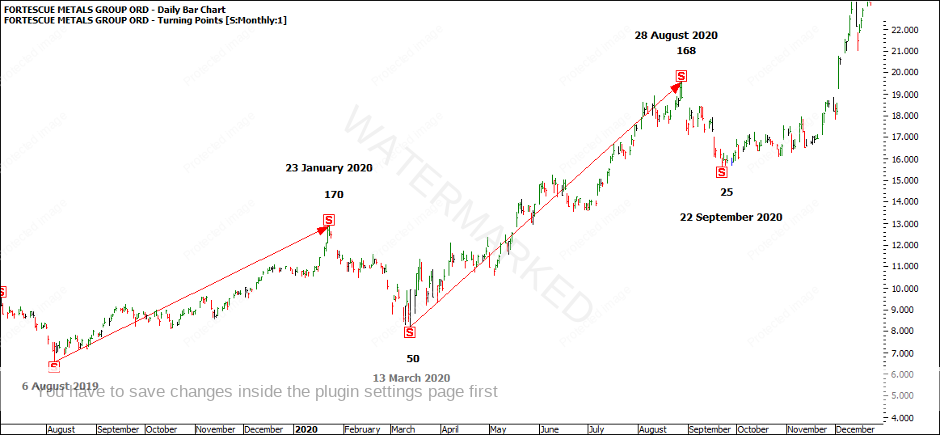
Now here is a recent and good example on a local stock FMG of the above statement and expanding and contracting time and price swings. I want to focus on the previous two monthly sections starting from the 6 August 2019 low, the 13 March 2020 low and the current monthly section up from the 22 September 2020 low.
Chart 1 – FMG – Daily Bar Chart
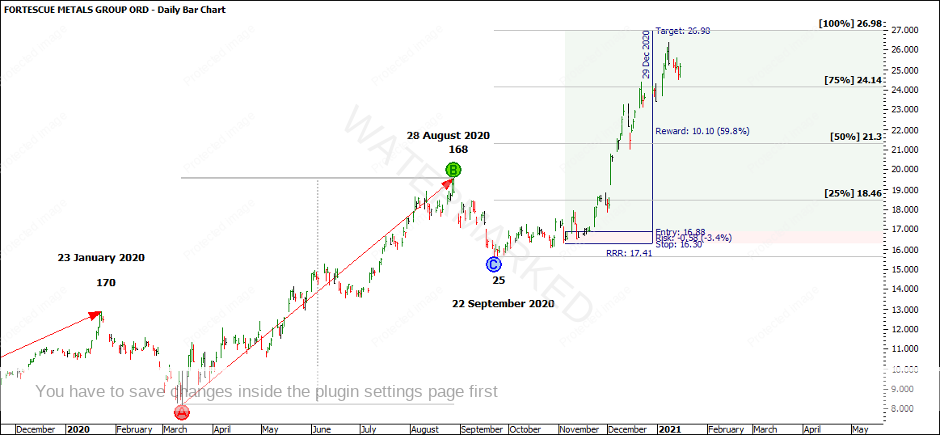
I’ll let you pick apart Chart 1 to apply all the key concepts out of Chapter 2. In Chart 2, I’ve highlighted one potential first higher swing bottom trade out of the weekly higher swing bottom that could have the potential for a 17:1 Reward to Risk Ratio for the one position, let alone the extra potential trades for compounding.
Chart 2 – FMG – Daily Bar Chart
- With a risk of $100 for the one trade, that would be a potential profit of about $1,700.
- With a risk of $500 for the one trade, that would be a potential profit of $8,500.
- With a risk of $1000 for the one trade, that would be a potential profit of $17,000 per trade
- With a risk of $5000 for the one trade, that would be a potential profit of $85,000 and so on!
If you’re not interested in looking at a stock or even this stock, take the concepts out of Chapter 2 and apply them to your market of choice.
Markets don’t unfold perfectly 100% of the time according to Gann rules, but often enough they do. It just comes down to have you studied enough opening games, middle games and end games so you’re prepared for the next move when everything lines up.
Happy Trading,
Gus Hingeley

