Right On Time
On a handful of occasions last year, I delved into a market that has been both friend and foe over the years. Copper has the tendency to trend strongly over the years when it chooses to move, and the flip side is that it can erode profits whilst attempting to trade in a sideways period that can be quite the whipsaw over a sustained period.
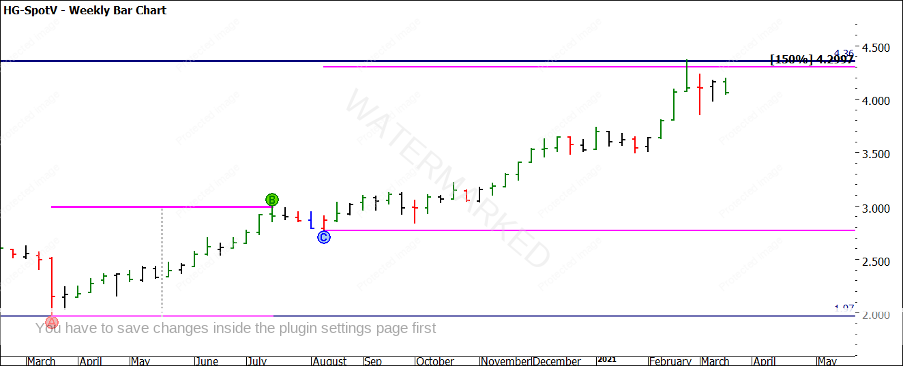
We are now 12 months on from many things around the globe, the COVID timeline has continued to run its course with a vaccination program occurring globally that was hard to imagine this time last year. We also saw a major March low in 2020 for the High-Grade Copper market on the 19th of March to be exact. In Chart 1 we see what can be described as a major bullish leg unfold as prices have doubled per pound in that time.
Chart 1 – Weekly Bar Chart HG-Spotv
The low on the 19th has led to a strong bullish trend and offered favourable trading conditions along the way. I encourage you to review the March low from last year and plan to work through multiple trading entries and stop management systems to see what would yield the best returns matched to your trading style and risk tolerance. A suggestion is to look at the 2-day swing chart for reversals and stop management. It has been a lucrative way to manage stops over the last year.
Of further note on the bigger picture is the current top in February this year. The 25th sits on the 150% milestone of the first major bullish section. As we know, David suggests we look for a potential Point A of a reversal at this level. The question we should be asking in the near term is, are we likely to see (or have we seen), the high come in already? Then following from that, is the next bearish movement a rebalancing or the start of a major decline? Or are we likely to see a sideways market?
The questions we ask about what’s next, leads us in the direction of what analysis to perform next. There are too many technical analysis methods and concepts to place over a market and Gann was also not short of a technique or two. I find by framing the questions correctly it allows for a more structured approach to analysis.
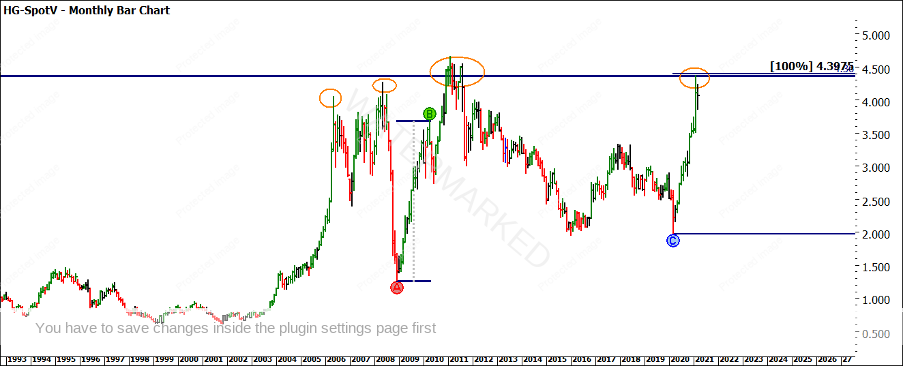
In Chart 2 we can see the price is starting to climb to “rarefied air” around the All-Time High in 2011 and around other major highs. Any push to record highs will require some major momentum to break through (what type of intermarket pressures could drive this?) The other analysis point I note is that the strong A to B move from 2008 to 2010 that unfolded over 16 months has been repeated in just 11 months in the current environment.
Chart 2 – Monthly Bar Chart HG-Spotv
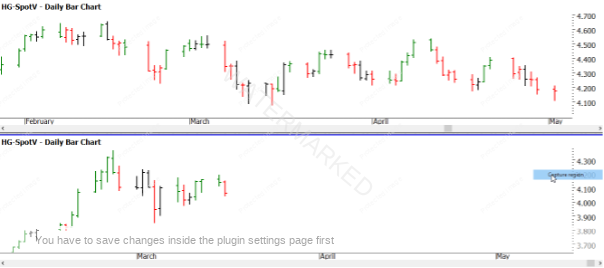
I find it interesting that the All-Time High came in on the 15th of February 2011 and the current high in 2021 is the 25th of February. If we feel there is some relevance between the two highs, we can drop them into a split-screen and track the tops as a zero date and watch how it unfolds from here.
Chart 3 – Split Screen HG-Spotv
Added to the puzzle we are seeing is that the anniversary of the major low in 2020 also aligns closely to the seasonal date in March. If you are looking for a simpler setup to drop into your trading plan combining Time by Degrees with anniversaries and Price Forecasting can be a simple yet powerful way to identify turning points.
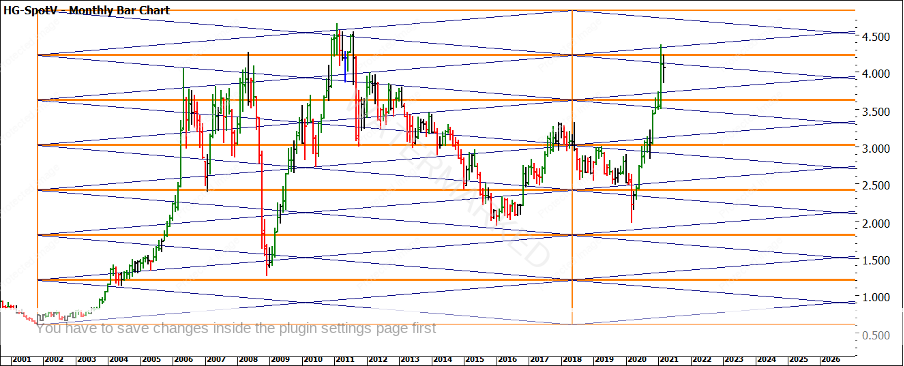
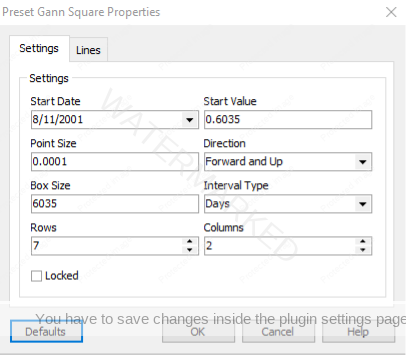
To date, I have only discussed Price and Time tools and we should always attempt to work across the three dimensions when analysing and stalking our markets. Using a Lows Resistance Card as a square is helpful on this market and I have selected the 2001 low as the reference point, the 8th of November at .6035 to be precise. In Chart 4 you can see how the diagonals have been useful in confirming highs and lows in the square by position of strength or weakness.
Chart 4 – Monthly Bar Chart HG-Spotv
I would encourage you to recreate this chart (details are below) and manually review each major turn on weekly and monthly charts to understand how this can be helpful to you and what level of accuracy this provides to you.
When looking for changes in trend, you can go back to your Ultimate Gann Course and look for the five key elements of a Classic Gann Setup that David taught: Time, Price, Pattern, Position, and Volatility. There are multiple ways to confirm the time and price side. The position of the market around previous major highs gets me thinking about a reversal or if momentum dictates a breakthrough to fresh highs. Finally, the steep run we have been on should encourage you to dig further.
As mentioned, there are some articles I penned last year that may be of assistance with the current position of the market. Take note this market can be a hard one when it decides to not trend but when you identify and get set in a strong trend (bull or bear) it can be the type of high reward to risk ratio setups that you should be looking for.
Good Trading
Aaron Lynch
