Setting up for a Trade – Part 3
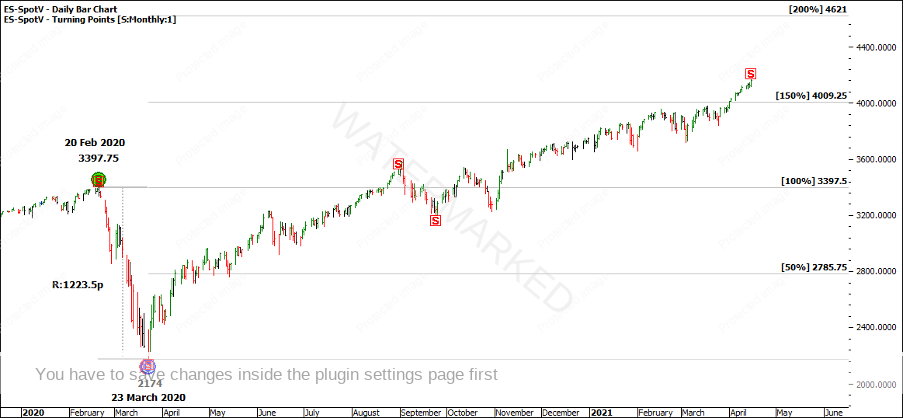
Welcome to the April edition of the Platinum Newsletter. As I write this on 15 April, the SPI200 is 113 points away from its pre-COVID high of 7149 points. For an interesting comparison, the S&P500 (ES-SpotV) is well past its COVID high of 3397.75 points.
If you take the range from 20 February 2020 to 23 March 2020 of 1223.5 points and multiply it by two, you get a range of 2447 points. Add 2447 to the 23 March low of 2174 and you get 4621 points. It looks to me like the S&P500 is well on its way to possibly achieving 200% of the range down.
Chart 1 – S&P500
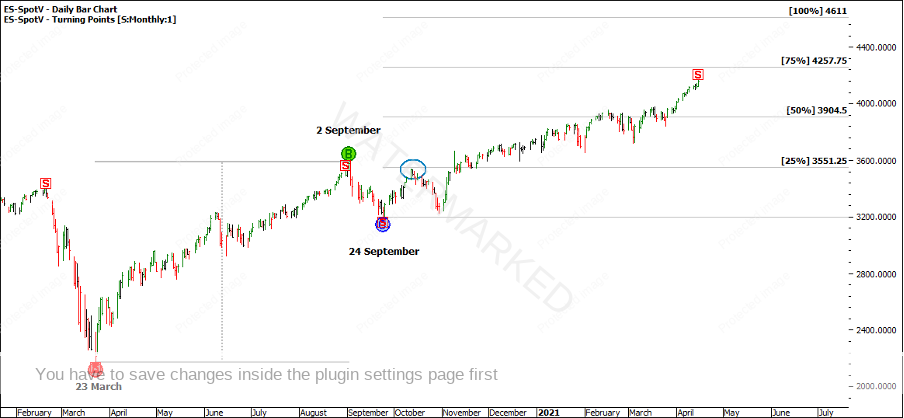
Ranges and Prime numbers are the foundation of the Smarter Starter Pack and Number One Trading Plan (now known as the Active Trader Program). You can check to see if 1223 has been a number of any significance in the past in time and or price, and this is one way of getting to know your market.
You could also utilise David’s 256 point lesson here out of the Number One Trading Plan to find a cluster that could potentially form the basis of a Classic Gann Setup.
Chart 2 – S&P500
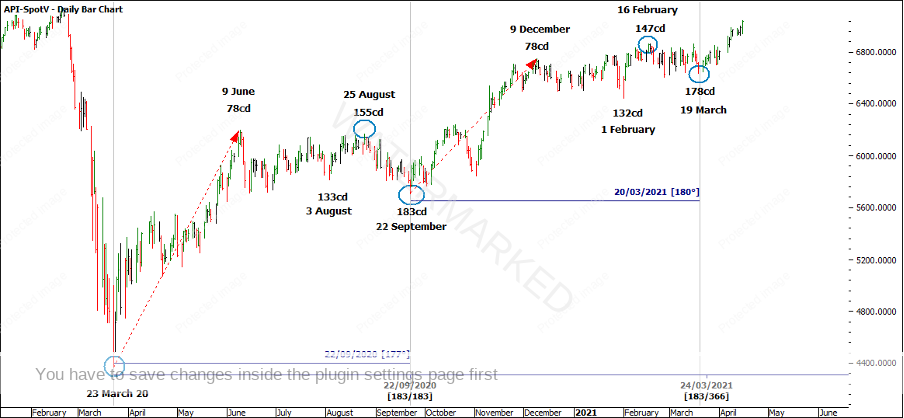
I now turn to the SPI and the pressure dates I’ve been watching leading up to March this year. In the February Platinum article, I looked at two dates, 21 February and 19-22 March. As the February date didn’t come together, I was left watching the March seasonal date.
A summary of the techniques from the last two articles are: repeating time frames, balancing of time and Time by Degrees.
You can see that as of 9 December 2020, the SPI looked to be repeating a previous sequence which although in the end didn’t give an exact 155 calendar day and 183 calendar day count to finish off with, it gave us ballpark areas to watch for.
The SPI then made its recent low on Friday 19 March. As the March seasonal date came in on Sunday 21 March it is important to watch a trading day either side. 19 March was also 179 degrees from the 22 September low.
Chart 3 – SPI Sequence of Time
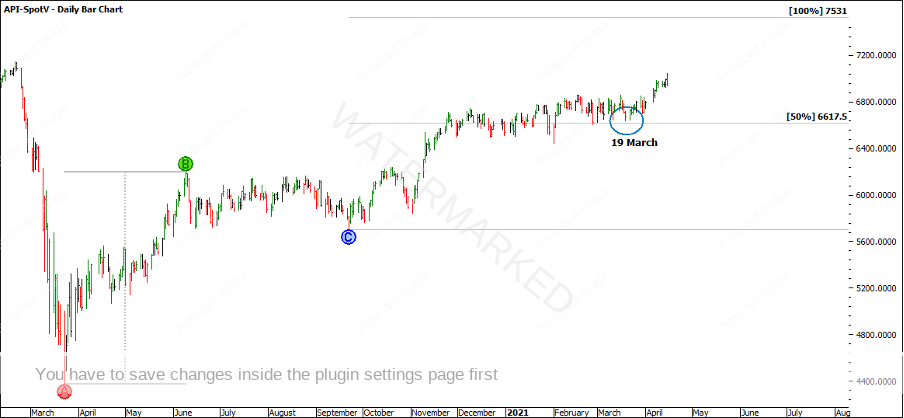
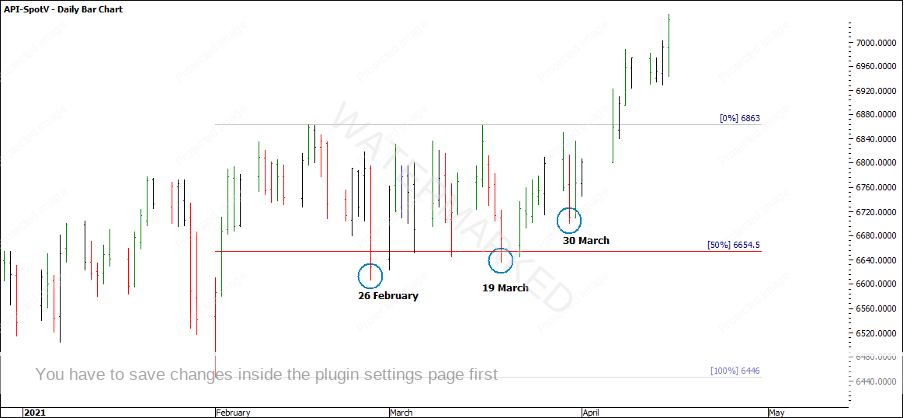
Although due to the sideways nature of the SPI, it was tough to come up with a cluster using the Price Forecasting techniques, however, it was a good sign to see the 19 March low come in above the 50% support level of the monthly ABC milestones.
Chart 4 – Monthly ABC Milestones
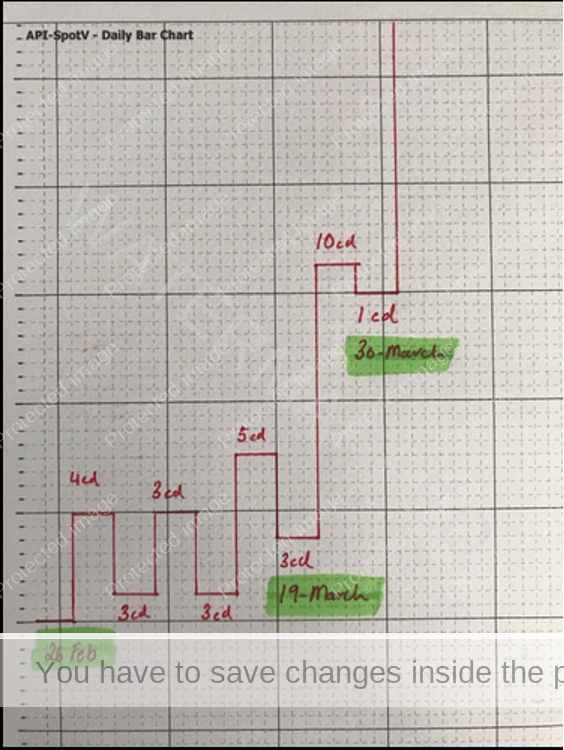
David says time is more important than price, and another time technique that helped to confirm the 19 March low was the Time Swing Chart. This is the same as Time Trend Analysis, just visualised differently. If you look at the market between 26 February and 30 March on a bar chart, it looks horrible for just about any trader!
Chart 5 – SPI Bar Chart
However, if you look at a Time Swing chart, it paints a vastly different picture. I’ll leave you to analyse it but the main point is, I saw 10 days up out of the 19 March low which is the longest daily time range up that we’ve seen this year.
Chart 6 – SPI Time Swing Chart/Time Trend Analysis
The SPI has broken to the upside although its trajectory has slowed somewhat in comparison to its monthly First Range Out. I still think there’s more upside to come but I always want to rate the market in terms of strength and weakness.
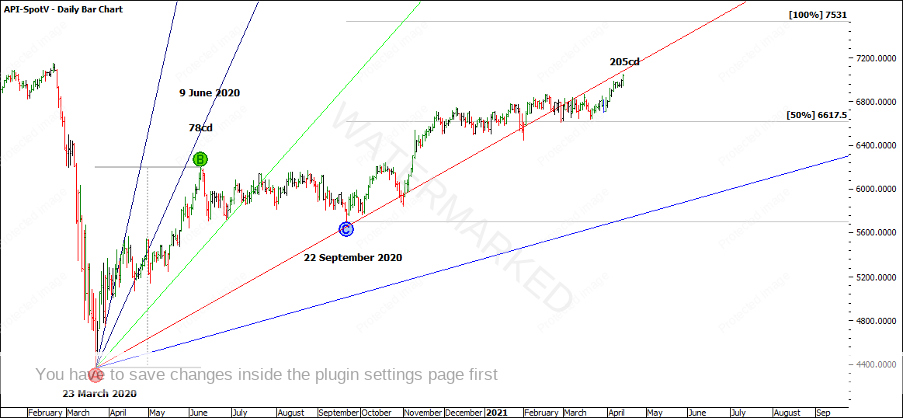
Looking at the Gann angles in trading days provides something of interest. Gann says that once one angle is broken it will go to the next. Looking at how the market has moved from the 8×1 through the 4×1 to find support on the 2×1, then moved through to the 1×1, it certainly looks to be true.
Currently, the SPI is trading under the 1×1 but holding in there. I think if it continues its run-up, it could get back above the 1×1 and would be in a stronger position. If the SPI starts to fall away from the 1×1, it could work its way towards the 1×2 as Gann says to watch for.
Chart 7 – Gann Angles
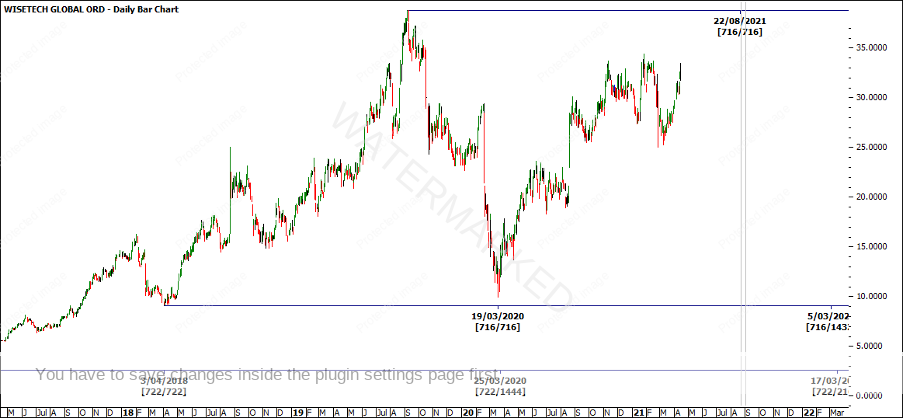
On a final note, the more I study David’s trades the more I realise how big a piece balancing of time played in his trading. Below is a potential example of balancing of time on an Australian stock called WiseTech Global (WTC). I think a top to top time frame 716/722 days apart looks like something worth watching out for, and as time approaches, seeing if it fits in with a Classic Gann Setup that aligns with your trading plan.
Chart 8 – WTC Balancing of Time
Happy Trading,
Gus Hingeley
