True to Form?
In last month’s Platinum Newsletter, we reviewed the position of the High-Grade Copper market. Let us briefly review where we left off from last month and where we currently sit in terms of the price action. We identified that the February high from the 2011 top may be relevant to the current position of the market when we reviewed the current position in 2021.
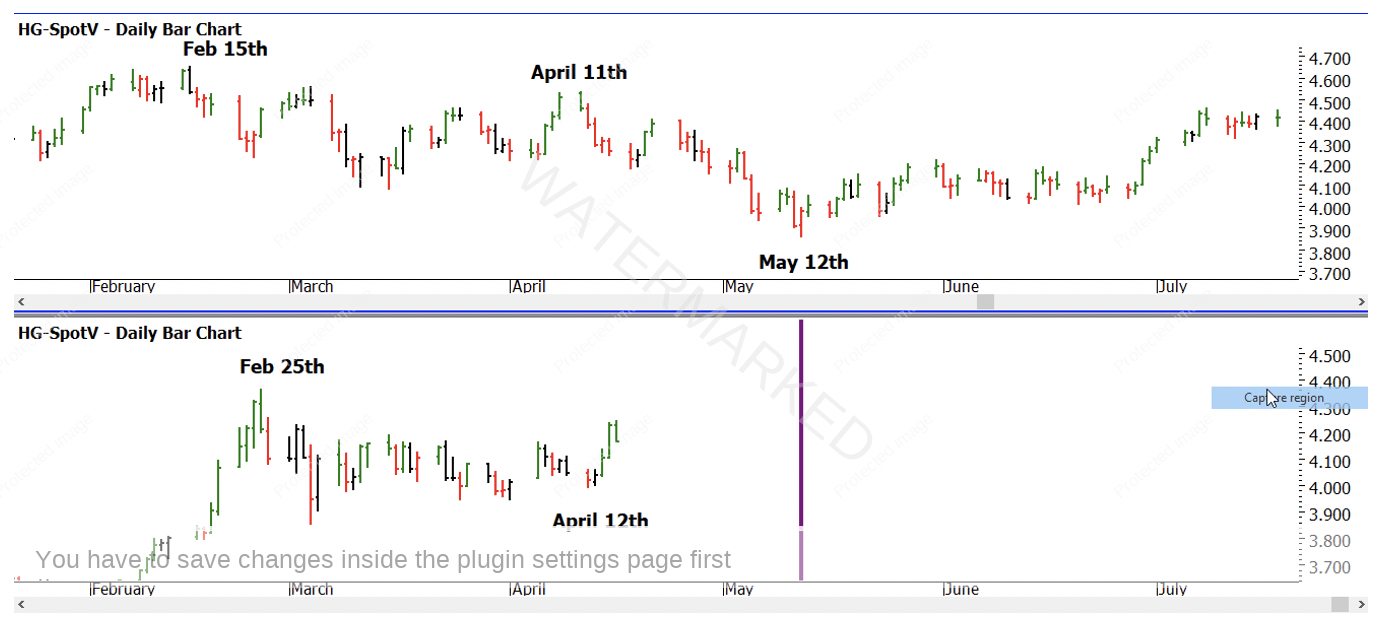
It is unlikely we need a reminder that history repeats. We use history as a guide to understanding where trends start and end and we can also use history as a guide to when it is a good time to be out of markets. The chart from 2011 shows that after the February high, the market moved sideways around the $4 per pound level for a significant period of time. If we review in Chart 1 the current position of Copper, we have seen the bullish trend pause in its momentum and move into a consolidation period. Can we use the Road Map from 2011 to understand its next move?
Chart 1 – Split Screen HG-Spotv 2011 vs 2021
I have heard David use the phrase “the market was not much good” after a particular date. In essence, we may be seeing that concept play out as the price action has made it difficult to extract decent reward to risk ratios since the February high. We are guided to the Road Map from 2011 to look to May as a potential for this to change. May 12th can be used as a road sign to our price action as a potential point to reset from.
It’s fair to say that the bullish run from March 2020 was a great move, now would be a good time to use this chunk of the market to test and refine your strategies for trade entry, exit and management, this strong move in price offered excellent reward to risk ratios, however, a plan to capture this needs to be in place prior to the next move.
We can now move back to some analysis on old faithful, the Crude Oil market. It has sprung back to life in a big way since April last year and you, like me, may be noticing the shift in the per barrel price more specifically at the petrol pump.
In Sydney over the recent school holiday and Easter breaks prices we are closing in on the $2 a litre price tag in some areas. It is interesting to see as the last time I saw prices like this oil was well over $125 a barrel, not the $60 a barrel we see, none the less, my skills to explain petrol prices at a consumer level are sorely lacking.
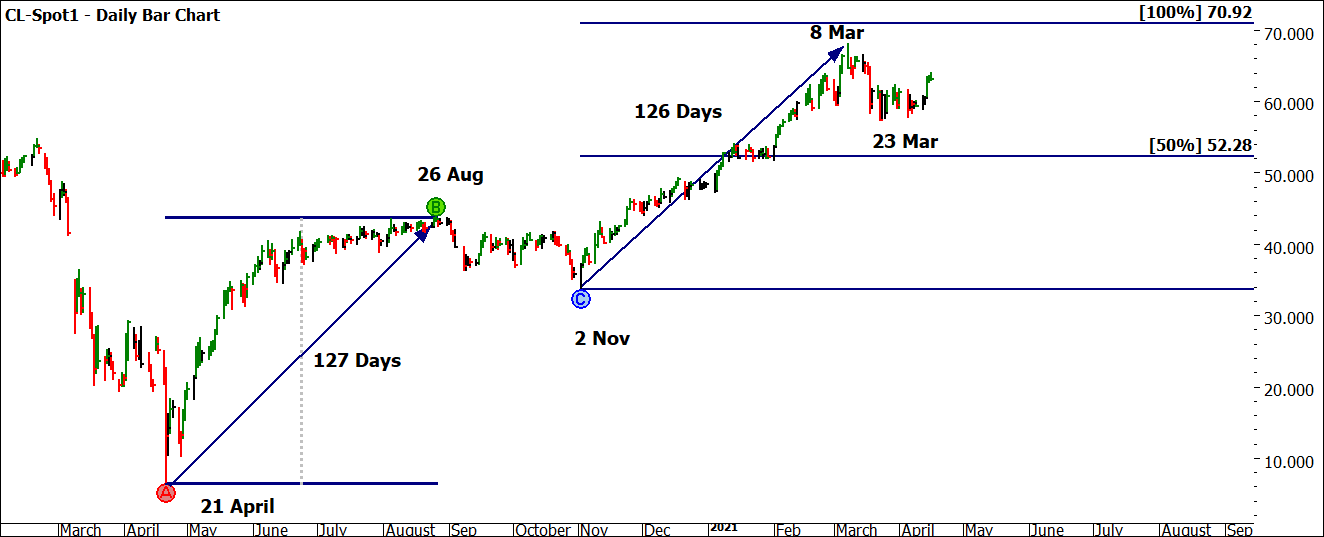
Chart 2 brings us up to speed on the last 12 months of oil prices as we recall the low (some called it the subterranean low) as we remember negative oil prices and the subsequent rally to approx. 10 times that low of $6.50 on April 21.
Chart 2 – Daily Bar Chart CL-Spot1
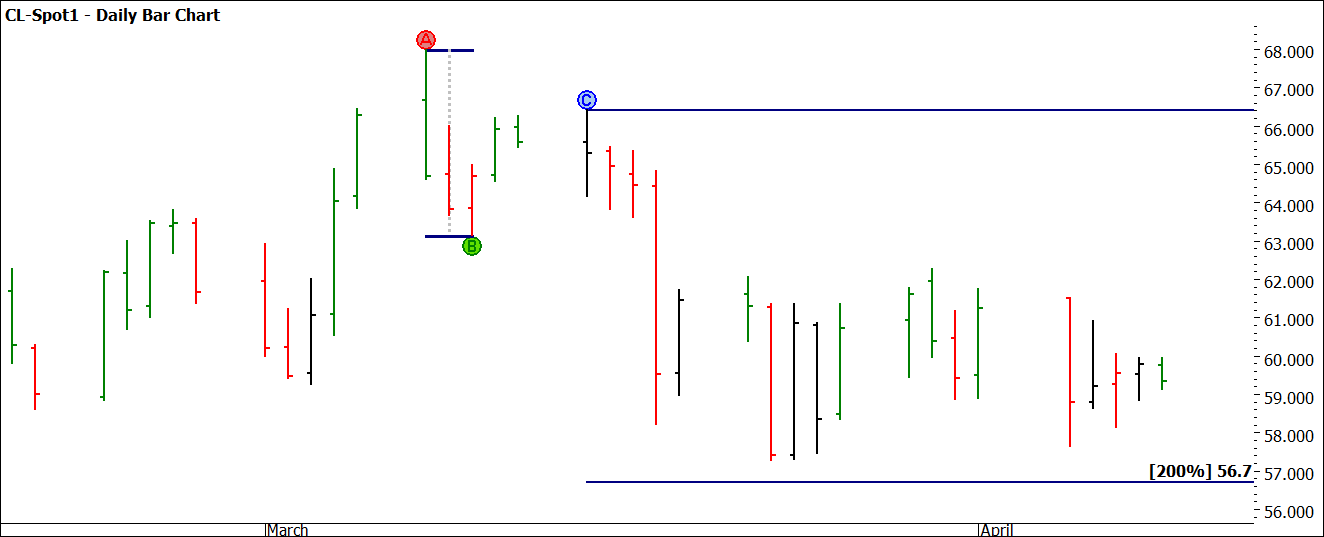
If we consider the two sections of price action the first into the 26th of August, we see a move of 127 Calendar days (always smart to check the trading day count as well). This was followed by the next section from 2 November to 8 March at 126 days. The price action did not repeat 100% so we could argue the move is slightly weaker than the first. The run down into the March seasonal date was short and sharp and provided a trading opportunity on two fronts.
Chart 3 shows the approach using the first lower swing top as an entry signal. There was also the aggressive approach of shorting the 8 March top as the next day was confirmed as a down day. Both the setups delivered profits based on how you managed stops. The reward to risk ratios were skinnier than the bigger market moves we usually look for, so we are now on alert for what the oil market next throws at us.
Chart 3 – Daily Bar Chart CL-Spot1
Mid-April in 2019 and 2020 both produced changes of trend so we would be wise to pay attention again as it rolls around again this year. My current dilemma in this market is deciding what is next: have we seen two sections play out with a third to follow and push us into the second half of the year to higher prices? Or are we seeing the current yearly high in already with sideways to downside price action to come?
I am not advocating a crystal ball currently or even the requirement to know the future and make a forecast. At a time like this I fall back on the toolbox of techniques we have, I would encourage you to look at the current position of oil and in particular its price action and work out if the market is balanced, if not is it running stronger or weaker compared to previous moves?
Now is an excellent time for some patience as we see this market move through its sideways period as it builds into a next leg be it up or down. There are plenty of hints and indications of its current strength to the upside, we must now be patient but also prepared to action the next leg as it unfolds.
Now is an excellent time of year to put some work into this market with the potential reward of another repeating leg to the upside delivering oil prices around $90 a barrel – a level not seen since 2014.
Good Trading
Aaron Lynch


