Can We Go Higher?
As we continue our series on the Nasdaq index in the US, the logical question is can this index go any higher, or are we seeing it run out of steam? Is it time for a correction, crash, or other event? Well, we do have the benefit of our time-based studies and this can add immense value in understanding when and where the markets can change trend. This topic has a level of complexity that you must study first and put in some “research time” before you can even step into the shoes of those who have walked before us by calling tops and bottoms in advance.
Let us keep it simple and look at the technical and sentiment-based analysis that I have been across in recent times. Can we go higher? Yes of course we can on the Nasdaq and anyone calling highs and shorting this market in 2021 has no doubt been burnt. In fact, the simplest of technical analysis systems is to buy when a market makes fresh highs, that strategy has been a strong performer since the last pullback which we now associate with the COVID crises.
Sentiment and fundamental analysis look to value assets as cheap, fairly priced, or expensive. I get the opportunity to meet with fund managers and especially superannuation investment teams and the overwhelming message I have heard them say is markets are not overvalued in the US and that an economic crash is not likely i.e., a Global Financial Crisis style of fall. They are, however, concerned about a geopolitical event, in simple terms, think war. A study of markets shows that wars, after the initial fear, led to strong bullish trends as innovation and invention bring forward new thinking. Many of the world’s advancements have been off the back of wars and in the longer term a benefit to economies, but that stark view does not consider the human cost and devastation that they bring, so I am certainly not advocating that as the way forward.
Assuming we have no black swan style of events, the thinking in the hallways of traditional large fund managers is the trend is likely to continue, especially whilst interest rates remain next to zero as capital needs to find a home and with the global printing and stimulus measures in the last 10 years there is plenty to go round.
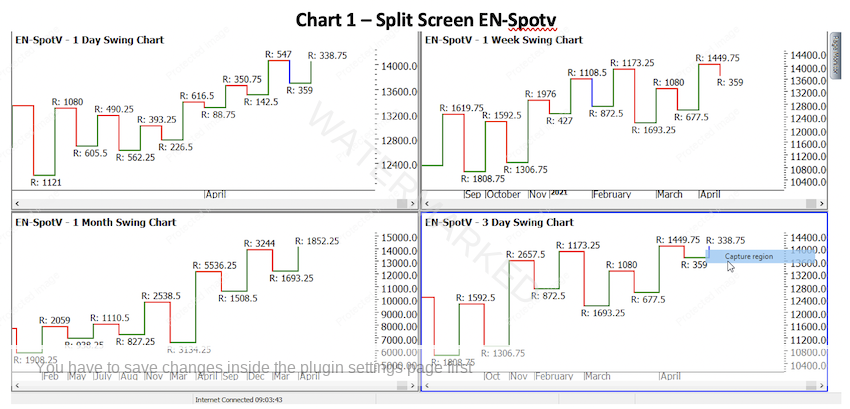
As traders at Safety, we are aligned with whatever markets offer us in terms of trend. To put it simply we are trend traders and take counter-trend trades when we have strong reasons to do so. Chart 1 shows swing charts in a split-screen across 4 major time frames.
All four time frames show us a series of higher tops and bottoms on the swing charts so we can agree that primary, secondary, and tertiary trends are all up. There is immense value in sticking close to your swing charts on various time frames as they were the initial place I started to unpack the “Wheels within Wheels” philosophy.
Another recommendation at this stage would be to pull out the swing ranges on the various time scales and see how they mathematically fit with each other. Are they multiples of one another? Is there one number that seems to be divisible into a majority of the ranges that could be acting as a prime number? It’s here in the detail that we can break down what is repeating in the ranges. Whilst this does not change that the trend is up, it does give us a greater foundation to build our trading style around as opposed to a simple expectation it would continue.
Currently, the price level of 14000 on this index looms as the next round number and potential resistance or could that be support? Many markets suffer from round number fever i.e., when a stock first trades to the $100 level it becomes a psychological level for some. In the case of the Nasdaq, it may be wise to review the other price levels that rounded at an even thousand prices. Did the market react to, or ignore these levels?
Given we are at record highs we are limited with the use of a Highs Resistance Card and a Ranges Resistance Card. We can still employ the Lows Card, and this can be helpful when we consider the phrase “lows call highs and highs call lows”. The challenge will always be which one, and this means we have to test and research the major lows, this assists us in knowing which lows to place more value on.
The major lows on the Nasdaq, as I see them, are the All-Time Low post the Tech Wreck fall of 2000. Then we have the GFC low in 2008 and we could include the 2016 and 2020 lows as relevant as well. When I project these lows, using the chart or even a simple excel spreadsheet, in the current price range above 14000 points, I see the four lows give us price areas to study that range between:
- 14248.5
- 14355
- 14483
- 14583
If we average these prices, we see an area around 14417 as an area of prices clustering. The first thing to research is how did I get those numbers and then secondly, are there other techniques that we can use to test if that cluster is worthwhile watching?
There is no better learning tool than having to deep dive into the detail of market numbers and then reverse engineer the numbers to test if they are useful in to the future. This article leaves more questions asked than answered, but there is a reward at the end of the process for those prepared to go there.
Good Trading
Aaron Lynch
