Coffee Turning Point
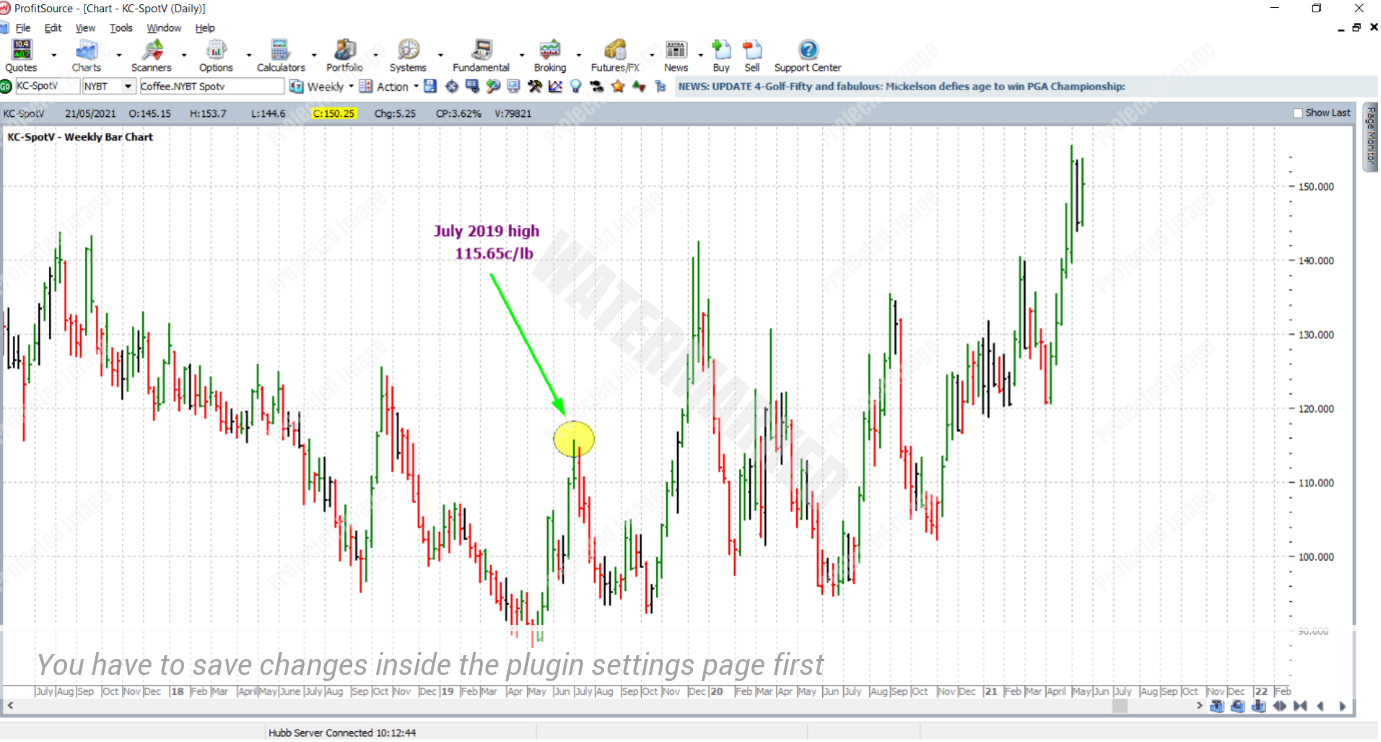
This month’s article looks back on the Coffee market’s recent history. As you can see in the weekly bar chart below (symbol KC-SpotV in ProfitSource), this market has produced a number of sharp turns in the last few years. This time we will consider the tradeable turn from July of 2019.
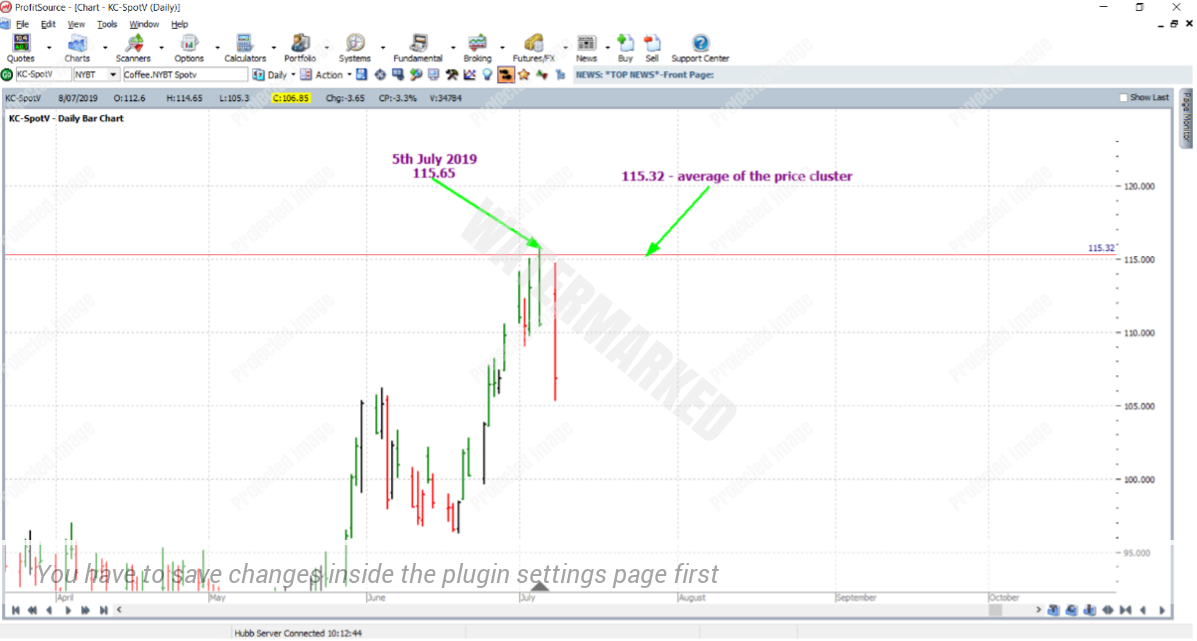
There were three solid Price Forecasting reasons for the July 2019 high and these averaged out at 115.32 cents per pound, so the high itself at 115.65 only false broke this level by a very tolerable amount. This is illustrated closely in the daily bar chart below in Walk Thru mode. As you can see, the error is quite small in relation to the average size of a daily bar. See if you can recreate the price analysis using your skills from ATPOT (Active Trader Program Online Training) or otherwise. Send it in and as usual and we’ll be happy to offer you some constructive feedback.
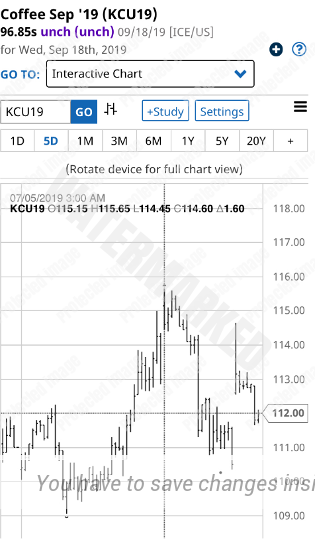
With strong enough reasons to enter the market, we can look to the intraday chart. Below is a snapshot from barchart.com, showing the 30-minute bar chart of the September 2019 Coffee futures contract, at the time of the July 5th high. Trading the first lower swing top on this chart would have had you entering the market at 114.95 (1 point below the low of the inside bar of 4.30 AM (New York Time) on the 5th of July 2019), with an initial stop loss order placed one point above the high of the 4 AM bar at 115.65.
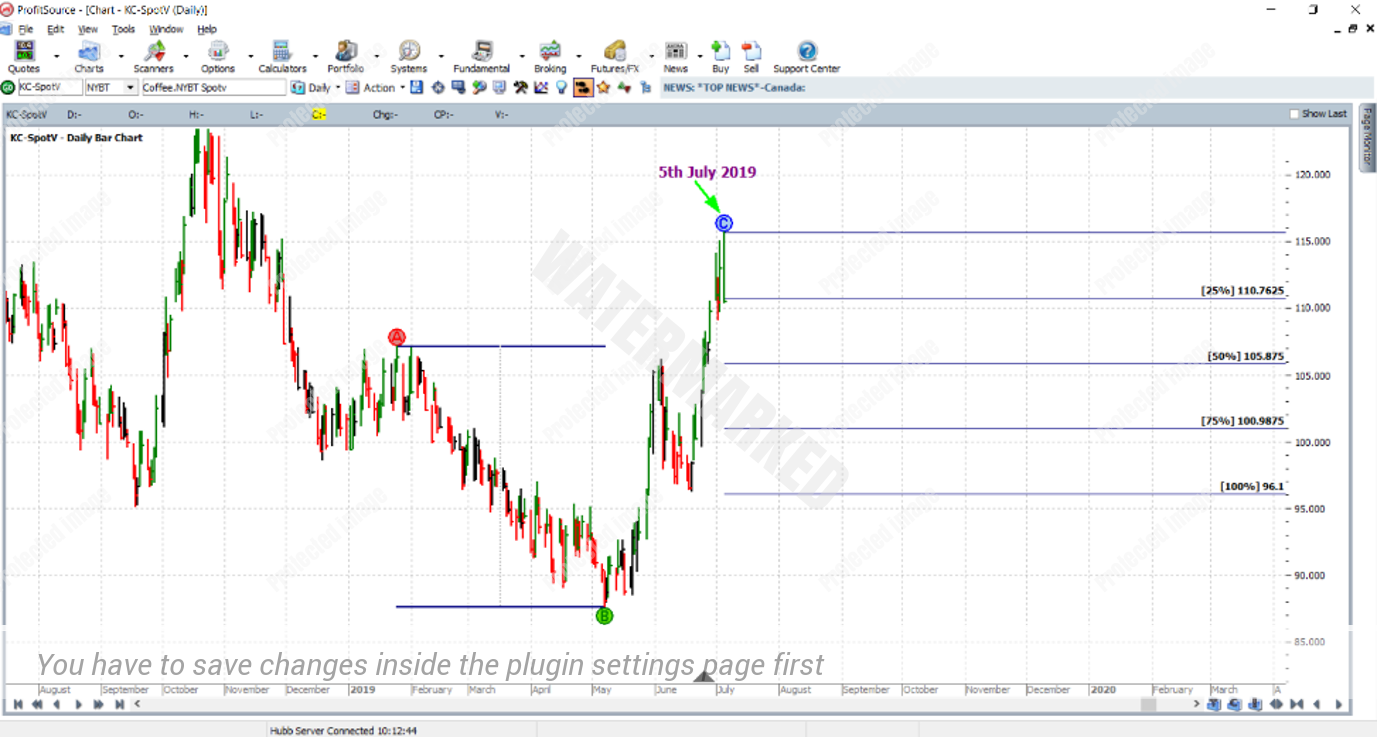
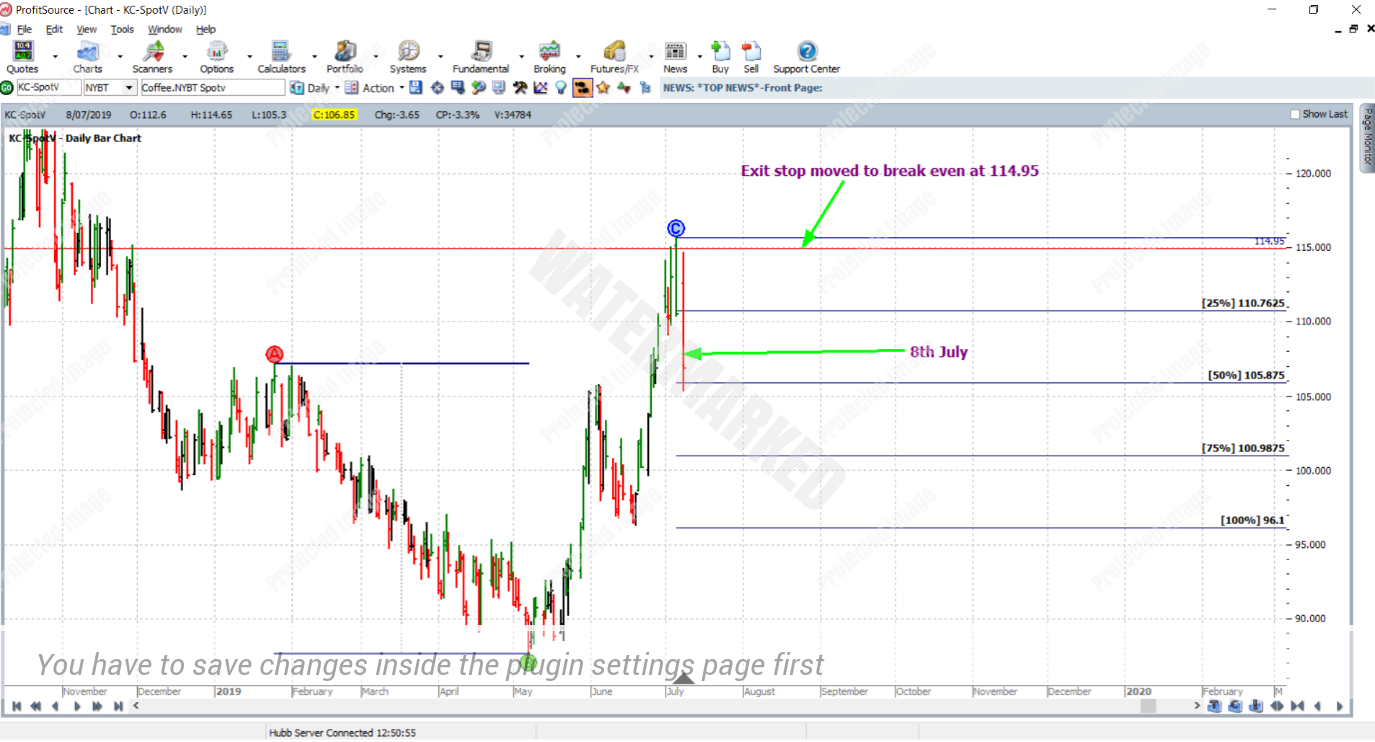
As you can see from the two charts above, soon after entry the move down would have had you in a healthy short position. Now for the trade management. The first step in this example is to choose a recent reference range. In this example, let’s use the downward range from 25th January 2019 to 7th May 2019. This reference range was smaller than the preceding monthly reference range, but still large enough to produce a high reward to risk ratio.
From here on, let’s manage the trade as though it were a normal ABC trade managed “Currency” style. On the 8th July 2019, the market reached the 50% milestone – and stops were moved to break even.
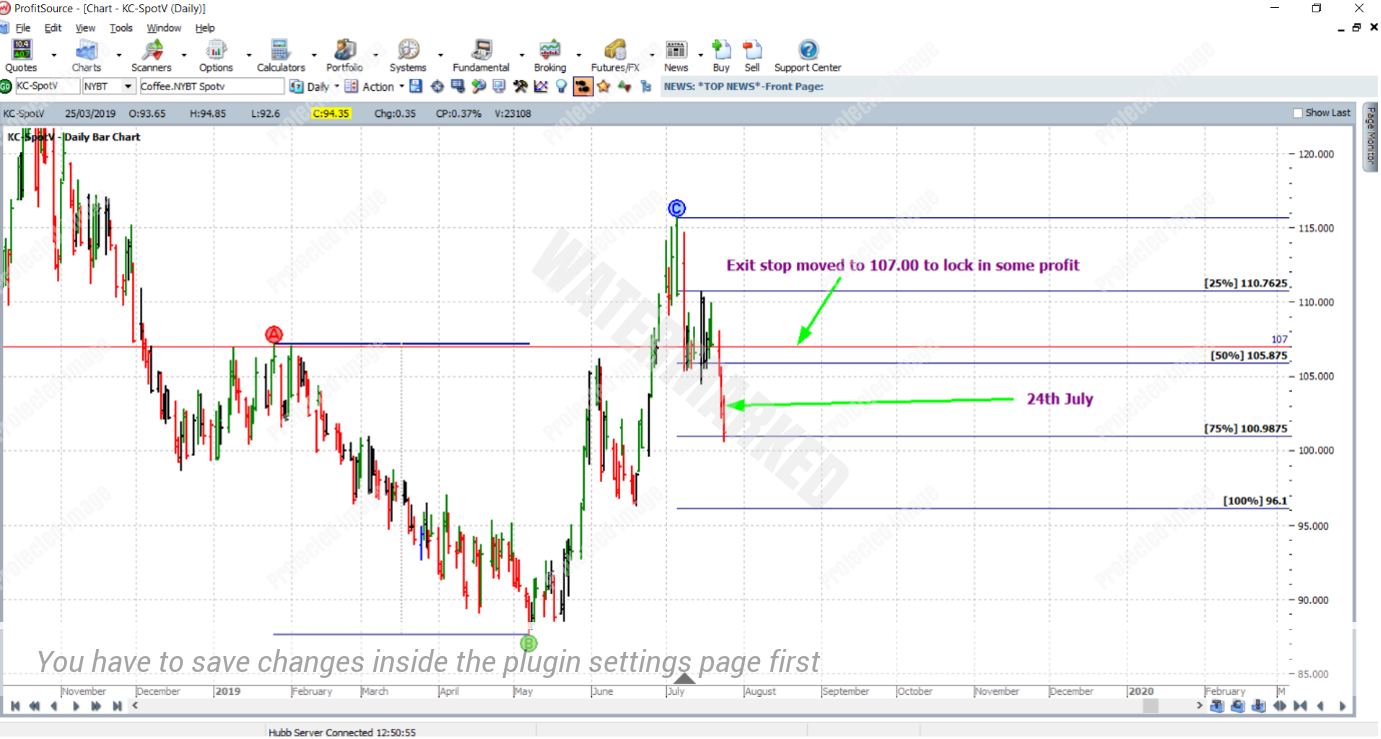
Then on the 24th of July, the market reached the 75% milestone. In this case, stops were moved to one-third of the average daily range (1.10 cents based on the last 60 trading bars) above the 50% milestone – to lock in some profit. If the range were any bigger, you could replace one-third of the average daily range with one-third of the average weekly range or one-third of the average monthly range.
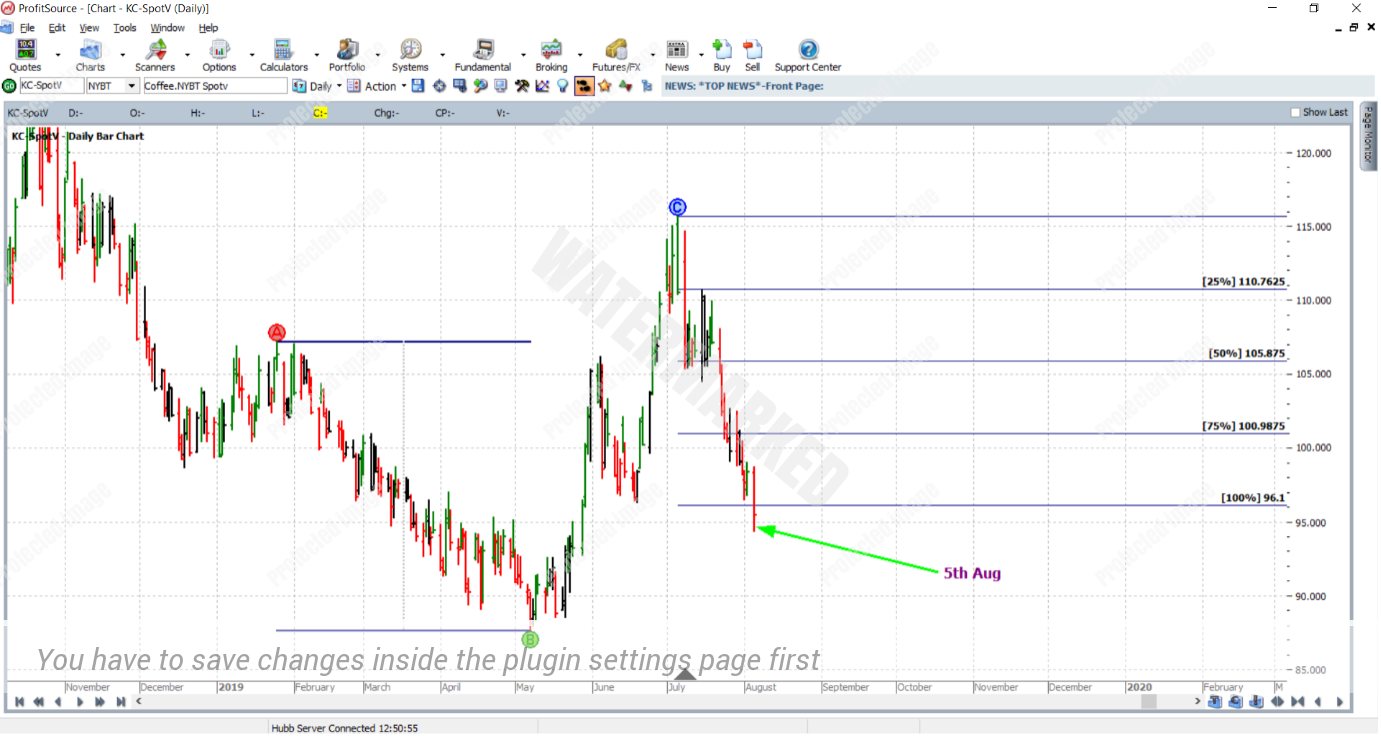
And on the 5th of August 2019, the market reached the 100% milestone and the trade was exited at a price of 96.10:
Now for a few different perspectives on the rewards. In terms of the reward to risk ratio:
Initial risk: 115.65 – 114.95 = 0.70 = 14 points (point size is 0.05)
Reward: 114.95 – 96.10 = 18.85 = 377 points
Reward to Risk Ratio = 377/14 = approximately 27 to 1
Coffee futures are traded through the ICE Exchange. If you look up the contract specifications on the exchange’s website, you can find that each point of price movement changes the value of one contract by US$18.75. So in absolute dollar terms, we determine risk and reward (in USD) for each contract of the trade as follows:
Risk = $18.75 x 14 = $262.50
Reward = $18.75 x 377 = $7,068.75
In AUD terms, at the time of taking profits this reward is approximately $10,463.
Given the aggressive nature of an intraday chart entry, we will assume that the $262.50 risked was a more conservative risk of 2% of the trading account size. This means that an account size of $13,125 USD would be required to trade one contract.
And finally, in terms of a percentage change to the account size, trading one contract would result in the following:
$7,068.75/$13,125 = 54% (to the nearest whole percent)
If you’re still looking to access this strongly trending market with lower margin and lower absolute dollar risk, many brokers will make it available via a CFD.
Work Hard, work smart.
Andrew Baraniak
