The Ongoing Value of 50%
As we continue to study and research the Nasdaq index, I still find it remarkable that a market that is as large and well covered, has continued its meteoric run against the backdrop of COVID and an economic shock that will be studied and spoken about for decades if not centuries to come.
This week we have seen economic data out of the US showing the largest jump in core inflation for an extended period. The concept of inflation and the genie escaping from the bottle has been a theme for discussion since the GFC over a decade ago. For whatever reason (including wild conspiracy theories) inflation has not behaved in the way that would normally be expected as the globe has embarked upon the creation and injection of capital into the world economic machine.
We have seen the Nasdaq index more than double in value from its lows in March 2020, a low which came in exactly 20 years from the 2000 tech wreck high. We can argue they are linked in time, where one brought technology and the promise of the new buzz word “internet” to its knees where in 2020 the pandemic showed how valuable the “internet” has become to deliver our day-to-day necessities and allow business to keep working. The takeaway for me is that markets can and will do things longer and further than what people expect, so trust the market and your charts.
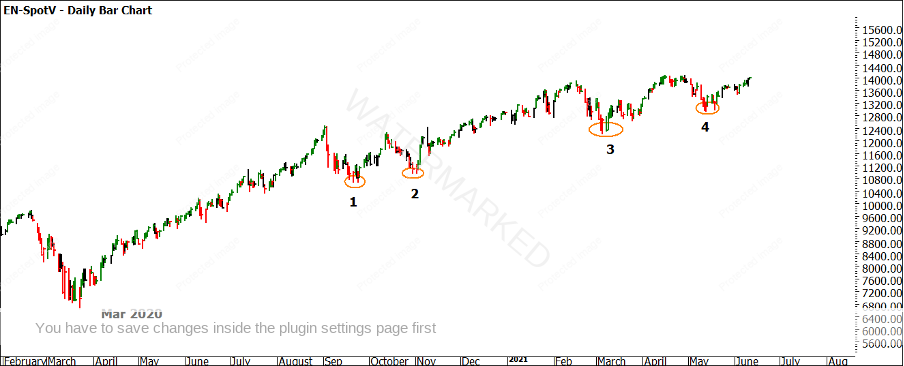
Chart 1 below focuses on four low points in the last year that would have delivered good trading outcomes if entries and trade management were effective. They should form the basis of research you can undertake and test using your preferred entry strategies. For the more advanced students, there are some time-based studies that link these lows together so you could investigate that further as well.
Chart 1 – Daily Bar Chart EN-Spotv
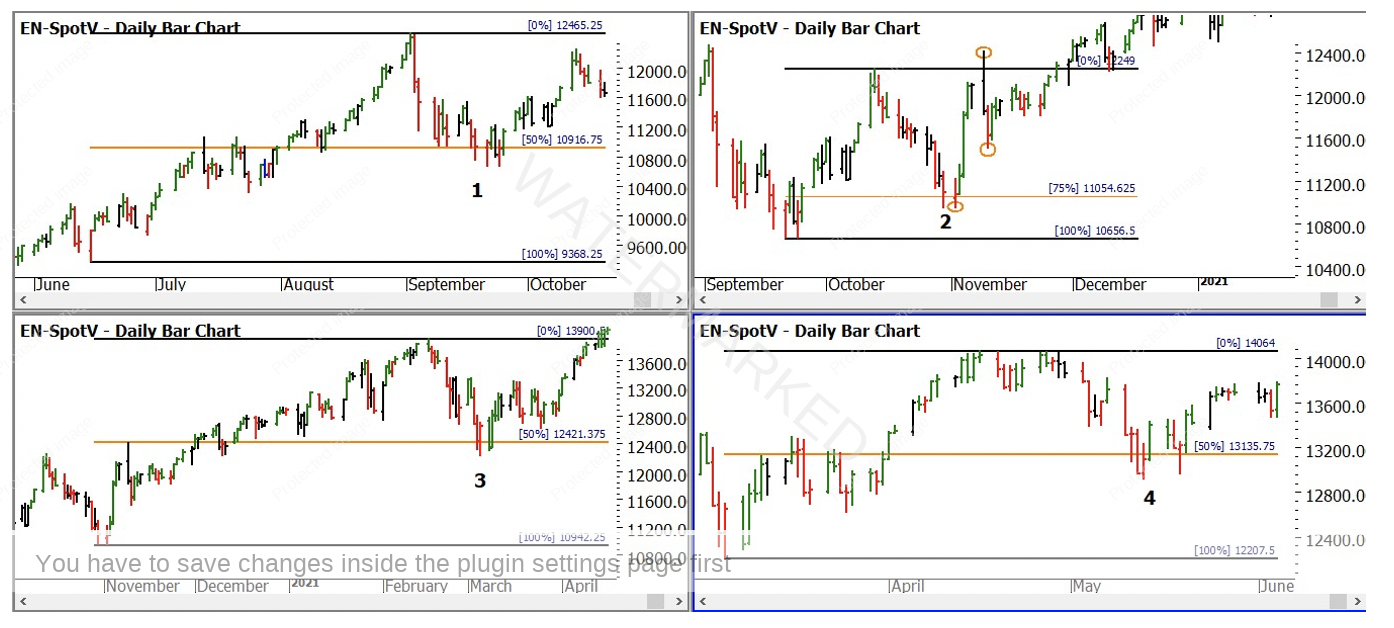
Chart 2 shows us the four lows in split-screen mode with the 50% level marked in each of them. In the case of low number 2, the retracement was over 50% and made its way to 75% approximately 6 months after the low in March 2020. It is worth noting that after that deeper retracement the market created a sharp upswing followed by a 50% retracement (marked by the orange circles) this may have provided an additional entry point or potentially if you had ignored the 75% retracement a safer place to enter.
Chart 2 – Daily Bar Chart EN-Spotv
In all of the examples we have identified, there has been an initial test of resistance and in all cases the price action has pushed through the milestone we would have been watching. I remember when I first found examples of markets stopping exactly to the point based on Price Forecasting, I became disappointed when it did not work that well every time. We need to allow for “lost motion” in the system and we can expect markets to move through our desired levels. We can see in all cases the close prices on the day testing the retracement level which has acted as support and in some cases a springboard to higher prices.
It pays to study these patterns very closely to see if there is a strategy we can develop to capture these changes of trend. In the very small picture of a few days of trading, you can zoom into the intraday chart of these markets (if you have access) and see what can be described as small double bottom patterns (on the daily chart) with lots of intraday confirmation of support.
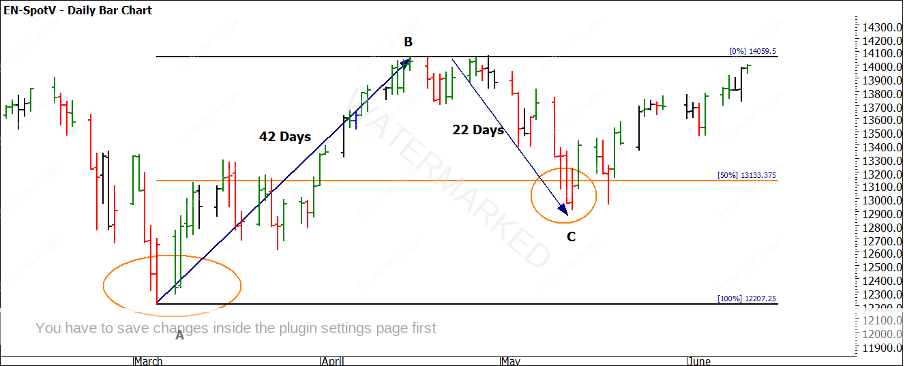
In Chart 3 we can see the most recent retracement into the low in May that was followed by a continued move to the upside. The repeating pattern of 50% retracement with a retest (think first higher swing bottom above 50%) is seen here. The value here is refining your form reading, think close prices, as well as designing entries and stops to maximise the risk and reward ratio you look for.
The larger ABC pattern I have marked is to highlight the time balance we see of 42 days up and approximately 50% back down (when using the average of the two April tops)
Chart 3 – Daily Bar Chart EN-Spotv
The strength of this index has shocked a lot of pundits, I can see opinions on markets continuing to dominate the news and online landscape. I will be watching for the time when the 50% retracements stop delivering as a place of market support, that may be a sign that the market is running out of upside steam. The good news is then we can watch to see the 50% act as resistance and the potential for short entries becomes a possibility.
Good Trading
Aaron Lynch


