Taking a Profit
Welcome to the July edition of the Platinum Newsletter. Last month I wrote about a double bottom trade on Telstra and the magic of the 200% milestone. I wrapped up by saying “the SPI looks to be kicking off a 4th weekly section up within this monthly section. How far will it go”?
Exactly one month later and I can now confidently say, not far at all! Over the past month, the SPI has felt like trying to start an old car on a cold morning, turning the key and hearing the engine turn over but not actually starting. Thankfully I haven’t had those kind of car troubles in a while, touch wood, but you can’t really avoid having those kind of market troubles.
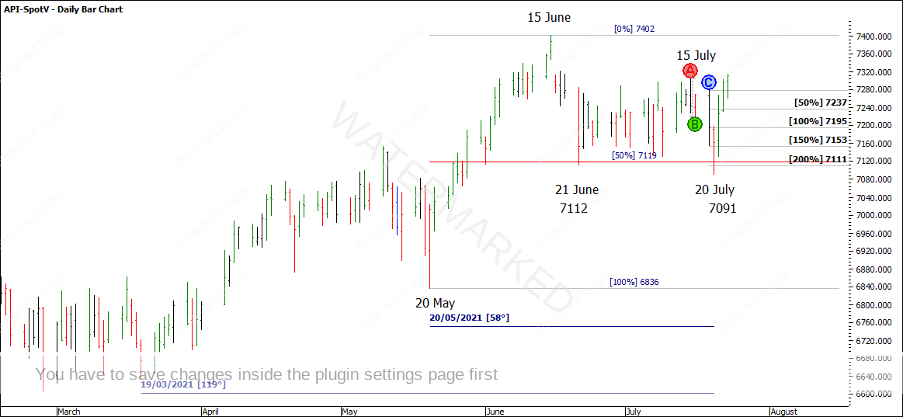
Chart 1 shows the current 20 July low at 7091, which has turned the monthly swing chart down and provided a nice-looking Classic Gann Setup. The average of the three prices below (7112, 7119, 7111) is 7114 points. In ProfitSource, the 20 July low of 7091 is well within a 1% tolerance for a false break. What I also liked about this low was that 60 and 120 degrees prior saw good runs to the upside.
Chart 1 – SPI Classic Gann Setup
Although, even if the SPI doesn’t get a clean break to the upside, the 20 July low provided good trading opportunities to enter and lock in or take profit using a 4-hour swing chart.
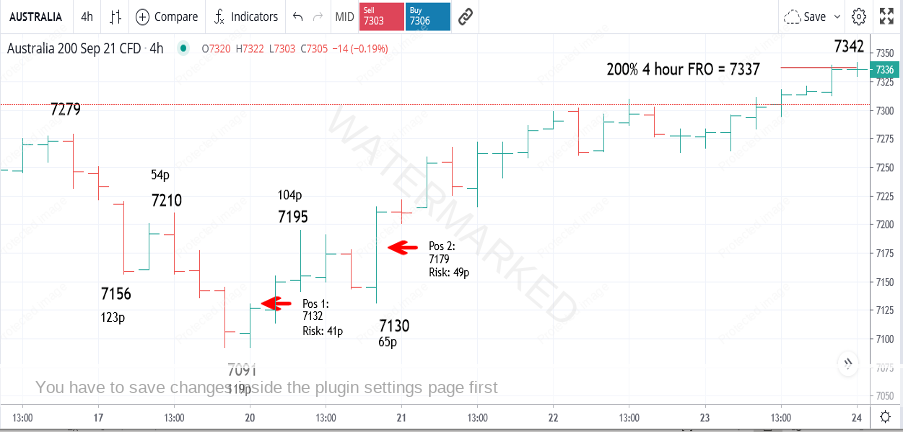
Chart 2 shows the 4-hour bar chart from the 7091 low and 2 hypothetical entries that could have been taken with minimal stress. It’s another great example of a contracting range into a cluster with the overbalance, re-test, and continuation of a trend up, only this time it’s on a 4-hour chart to get you tighter entries.
Chart 2 – 4-Hour bar chart
With contracting swing ranges into the low, you could have taken an initial position entering as the 4-hour swing turned up, which would have given a risk of 41 points on the trade.
After seeing the 4-hour failed re-test come in on 50% of the previous 4-hour swing down, you could have entered into a second position on confirmation of the 4-hour first higher swing bottom, with a risk of 49 points and moving the position 1 stop loss up, very close to break even. This would give you two positions with only one unit of risk.
I never know if the market is going to reach 200% of the FRO, but it’s a great milestone to be watching out for and a potential profit-taking point. So many times, I’ve built up a good profit, ignored the 200% milestone only to give it all back. In this case, the second 4-hour swing range hit the 133% milestone exactly so I felt 200% was a chance.
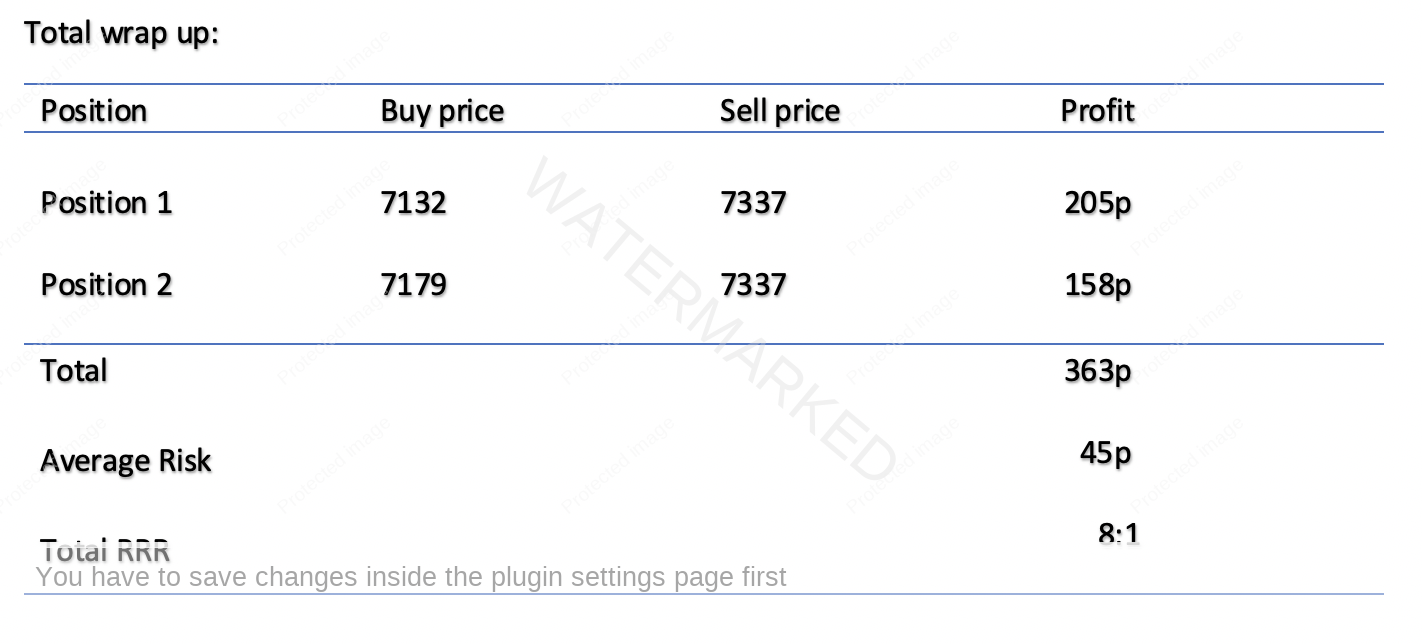
On Friday night, 7337 was hit and we now have a current high of 7342 at the time of writing. Had you taken profits at 7337, those two entries alone could have seen you lock in a total of 8:1 RRR in 4 days.
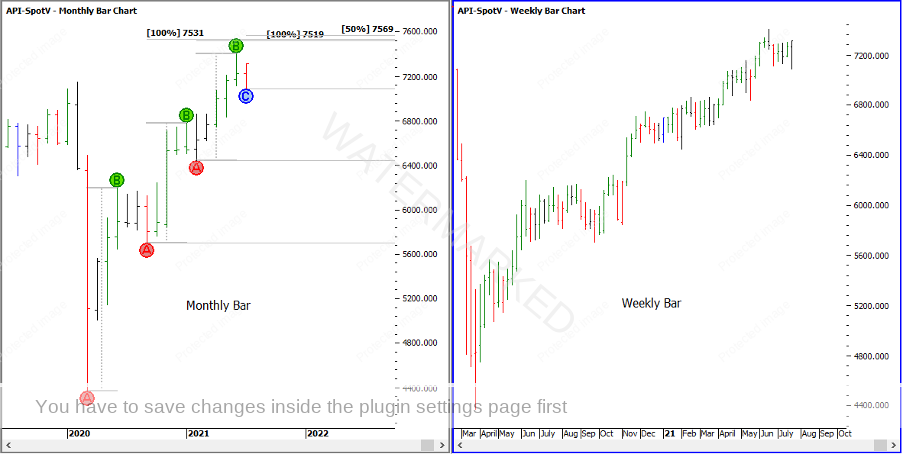
On the bigger picture, Chart 3 shows the current position of the SPI on a weekly and monthly bar chart.
Chart 3 – Weekly and Monthly Split Screen.
With the outside week breaking and closing above old tops and a potential (unconfirmed) contracting monthly swing low, it looks to me like the SPI is positioned for another burst to the upside, although there’s never any guarantees, especially if you write about it! As always, the swing charts will tell the story!
Happy trading
Gus Hingeley


