A Circle and a Cycle are the Same Thing?
I recently found myself reading some of David’s old articles and letters to Incubator students. I often find that I stumble onto some of David’s work at just about the right time that I need it in some aspect of my trading or as a reminder to keep things simple when I attempt to overcomplicate matters. I am writing, like many, from lockdown around the country in what is a grim outlook on the COVID front, combine this with the military overtones in Afghanistan we have disease, war, and all we need is a major weather event (yes there has been record heat and flooding in the Northern Hemisphere) and we have all of David’s three areas that can be forecasted: weather, wars and markets.
I am not surprised that the upheaval in Afghanistan is approximately 20 years from the beginning of the current chapter in that country’s history. Knowing the value and importance of “cycles” I am reminded by David’s comment that a circle and a cycle are the same thing just spelt differently. A circle has no end or beginning and is a consistent shape no matter the size of the circle. To me it highlights that if we can identify start and end points of cycles, we can attune our skills to extract our part of the move.
Our great challenge remains, to establish the start and end point on the time frames we trade as well as the really big picture stuff over years and decades. Take a deep breath as we don’t have to know the exact dates in advance to implement our trading plans, we just need to be good enough to recognise them quicker than most. I will jump into a review of the Nasdaq as well as the other indexes we discussed in last month’s newsletter but keep in the back of your mind the reference point many of us are old enough to recall from September 2001. The markets were predominately in a downtrend when the September 11th attacks occurred, but the markets responded and were followed by major turning points in mid-September, and we are now approaching 20 years from that event.
Last month I discussed the commodities movement that has been bubbling away under the radar as many commodities markets have been gaining strength, I referred to the GI- Spotv and the major 50% level that aligns at 557.5 points, you should head back to the chart and check where prices sit regarding that level.
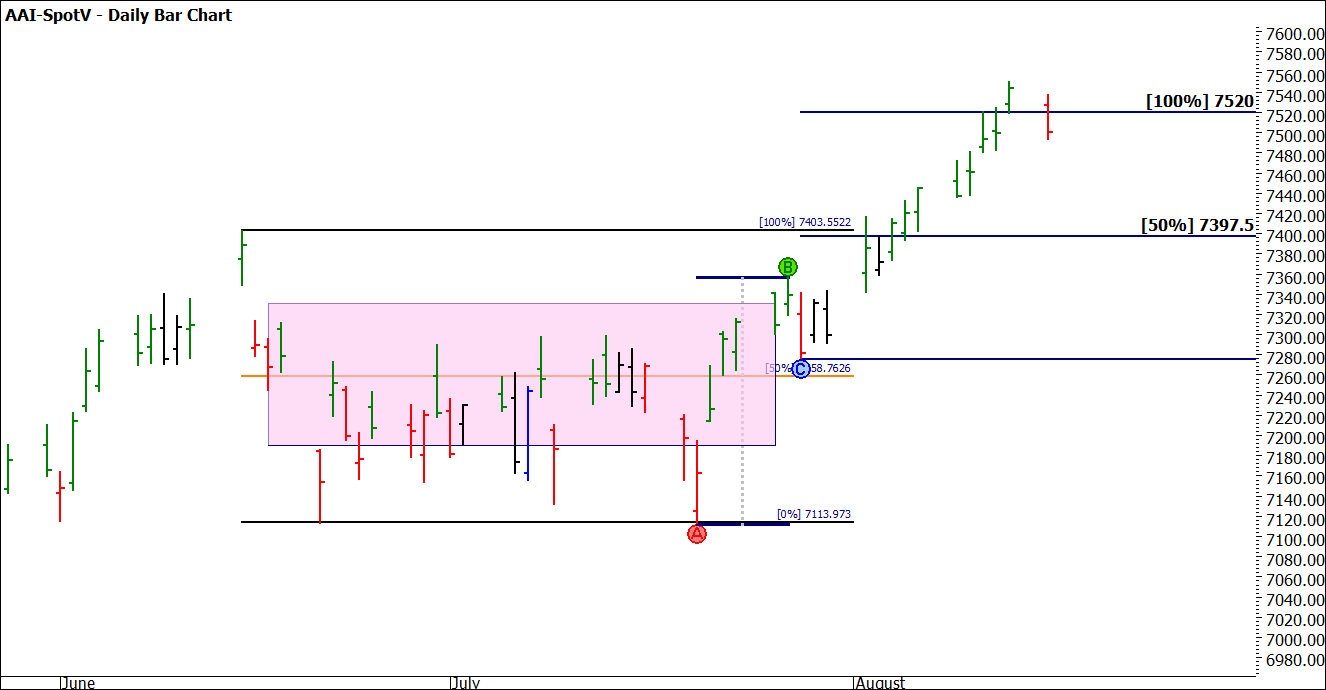
If we explore the stock index space, we see the SPI200 broken out of its sideways malaise and driven strongly higher. The 7400 level of earlier this year did not act as any major resistance and we see that the daily swing range has just repeated to approximately 100% of the previous range.
Chart 1 – Daily Bar Chart SPI200
As we are at record highs for the SPI we are again limited for upside projections to Lows and Ranges Resistance Cards, that combined with swing ranges over multiple time periods can assist in understanding future resistance areas. Using the All-Time Low multiples (458) we can understand where the market is placed without the chart. 16 multiples of 458 gives us 7328 and 17 multiples are 7786. If the A to B range marked in Chart 1 repeats to 200% that would be 7765 and in the ballpark of 17 multiples of the low.
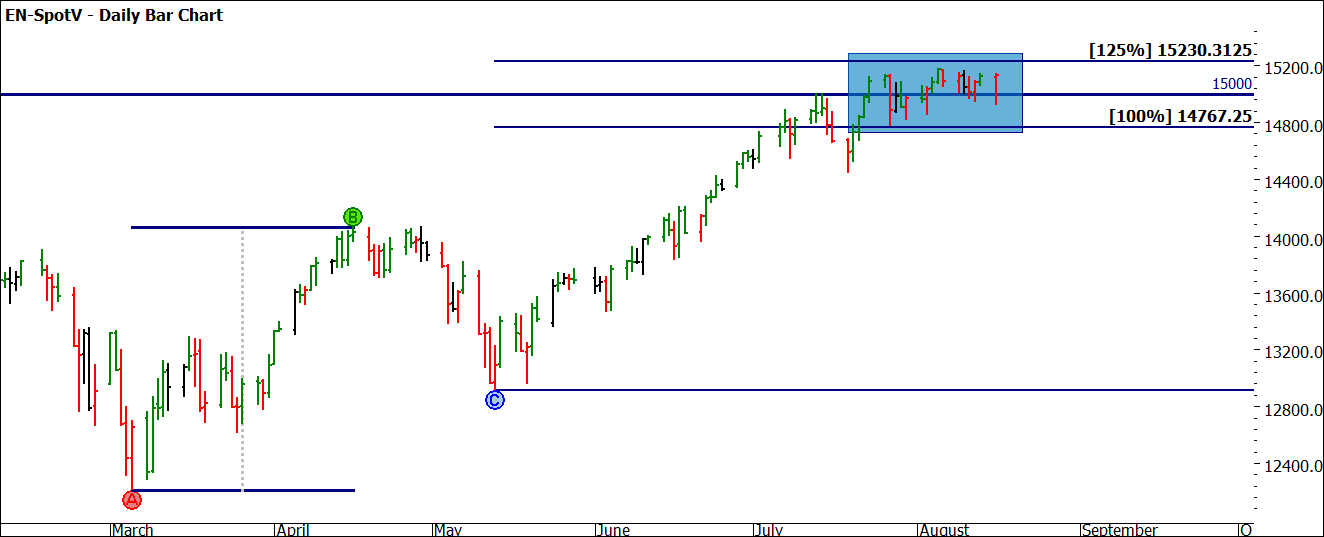
The Nasdaq has fallen into a small holding pattern as its takes stock of the current landscape. The 15000-point level has not held this market up and we now see some potential consolidation around that level. In Chart 2 we can see the current picture, it’s not surprising that this market needs a breather after its meteoric rise.
Chart 2 – Daily Bar Chart Nasdaq 100
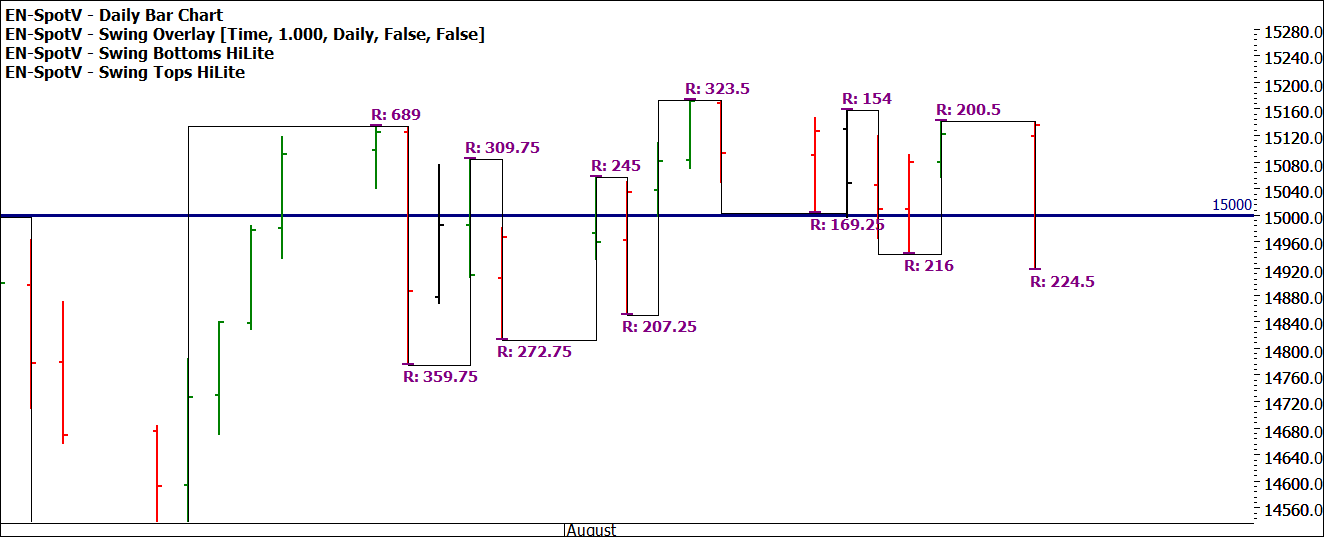
Around places of potential support and resistance, the concept of form reading becomes critical to interpret who is in control of the battle, the bulls or the bears.
Chart 3 zooms into the price chart, paying attention to close prices, support points, and swing ranges showing there is strong support into the close of trade on numerous days. We see regularly on down days (red bars) the close price being strong (close to the top of bars). The psychological price of 15000 also “seems” to be holding as a point of support.
Chart 3 – Daily Bar Chart Nasdaq 100
At this stage too, when looking to zoom in on form reading it can also be wise to include volume in your analysis. The measure of price movement and the number of contracts traded can be another insightful indicator. A quick check of the Nasdaq futures shows a below-average volume, this to me supports the wait and see approach that this market is currently working through. The option to be on the sidelines until a breakout either way is signaled may be a wise strategy.
Trend is down on the 1-day chart, 2- and 3-day swing charts are up as well as the weekly and monthly.
That suggests some patience especially if considering shorting this market (unless you have strong time and price reasons)
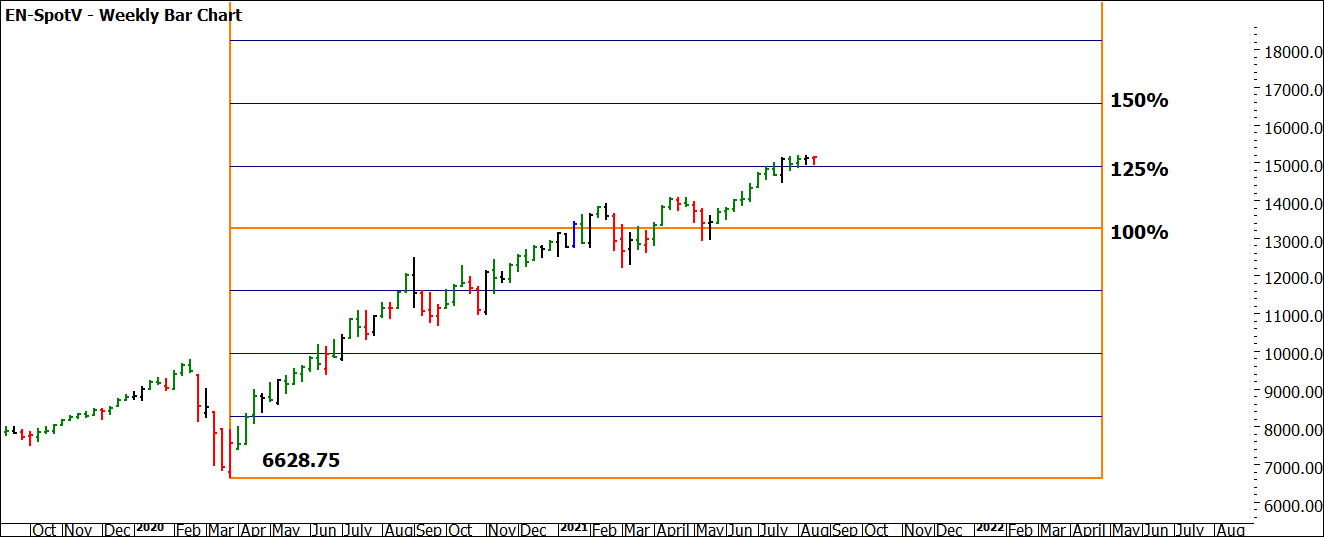
The final chart I will leave you with revisits the 2020 low (what we can now call the COVID low). Since then, the market has more than doubled in price. The low in March 6628.75 as a Lows Resistance Card shows we are currently holding at 125% of the low. This value is very close to 15000 and many will use the even number as the reason for support, I am happy to use it to validate the 125% multiple of the low.
If we consider our big picture milestones, this market is strong and until we can confirm a break back under those levels, we may just be taking a breath for another move higher.
Stay Safe
Aaron Lynch


