Taking a Break
Welcome to the August edition of the Platinum Newsletter. First up I would like to put a shout-out to all the readers affected by COVID in NSW, Victoria, and any other country that’s experiencing long extended lockdowns. I’m sure it’s an incredibly challenging time for many and I wish everyone all the best.
Being a Safety in the Market student, I’m still studying course material, although at present I’m having my first short break from the markets this year to reset. Being out of the market for at least a couple of weeks does wonders to regain a sense of clarity.
A lesson I’ve learnt this year is to stop trying to be ‘right’ all the time and just focus on taking better high-quality trades with good RRR and minimising your losses. I’ve identified that most of my losses occur at the start of a move trying to get set, so if I can minimise these then I can achieve my goals faster.
A great point that David makes for a beginner trader is the percentage return you need to make on your capital after a loss just to get back to square again is always greater than the % of capital lost. For example, if you lose 10% of capital you need to make 11.1% on your remaining capital to get back to square again. If you lose 20% of your capital, you need to make 25% on your remaining capital to get back to square. If you then lose 50% of your capital, you need to make 100% on your remaining balance to get back to square again, although if you have just lost 50% of your capital then what are your chances of then making 100%? Probably very small.
| Account Size | Percentage Loss | New Account Size | Percentage Gain Required |
|---|---|---|---|
| $10,000 | 10% = $1,000 | $9,000 | 11.1% |
| $10,000 | 20% = $2,000 | $8,000 | 25% |
| $10,000 | 30% = $3,000 | $7,000 | 42.857% |
| $10,000 | 40% = $4,000 | $6,000 | 66.666% |
| $10,000 | 50% = $5,000 | $5,000 | 100% |
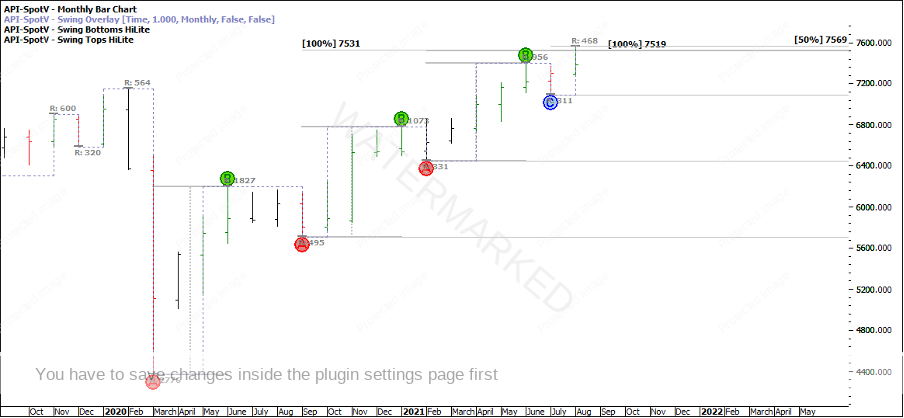
Looking at the SPI, in my last article I put up a monthly chart showing a cluster of 3 monthly milestones. These being:
- 100% of the monthly FRO from the March 2020 low = 7,531
- 100% of the next monthly swing range = 7,519
- 50% of the current monthly swing range = 7,569
Chart 1 – Monthly Swing Chart
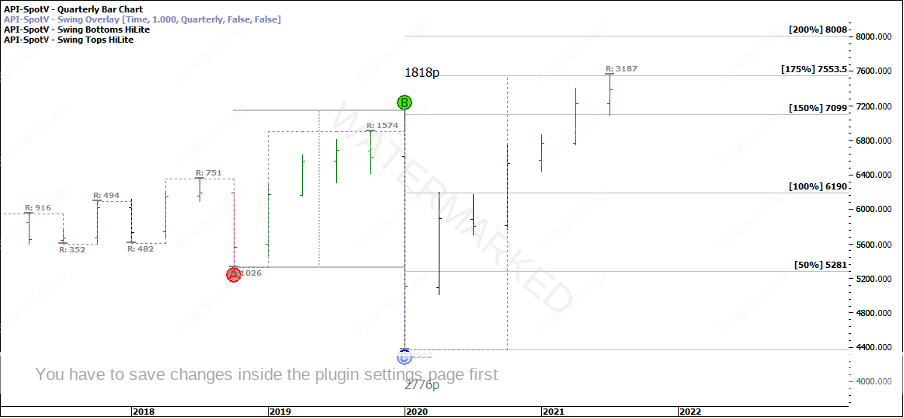
So far two of the three prices of the cluster have been hit but how did that all fit in with the bigger picture of the quarterly swing? Well at the time of writing, it’s hovering around the 175% milestone. Not quite a 200% overbalance although still well into the ‘Winter of the Trade’. Nothing would surprise me in the current climate in terms of how far markets could go but I still watch my charts to form a basis of my analysis.
Chart 2 – Quarterly Swing Chart
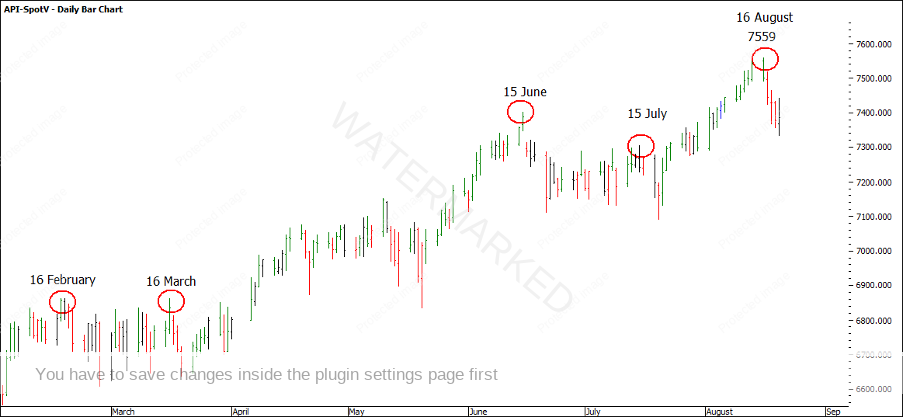
At the time of writing, the current high was 16 August at 7,559. A 16 August top shouldn’t have been of any surprise to the SPI traders as February, March, June, and July monthly highs have all been around the 15th-16th, Time by Degrees working beautifully!
Chart 3 – Time by Degrees
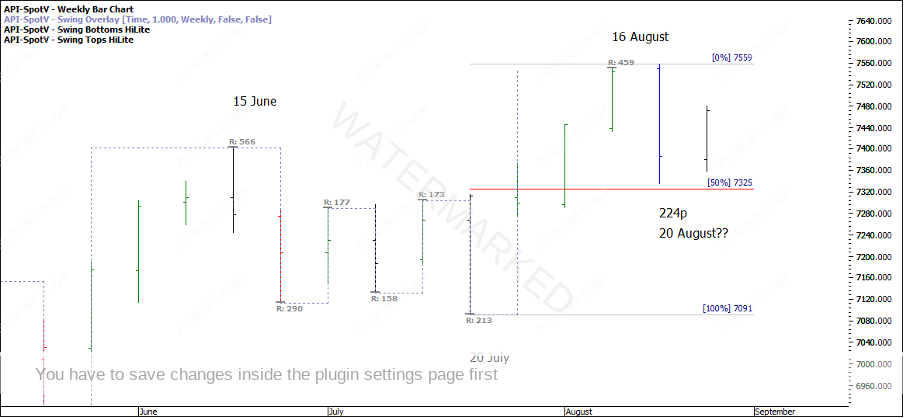
So, is this shaping up to be a monthly swing top or a first weekly range out and pull back on the weekly chart before more upside? The weekly swing has overbalanced to the upside and has done less than a 50% retracement and is sitting on the old top of 15 June.
Chart 4 – Weekly Retracement
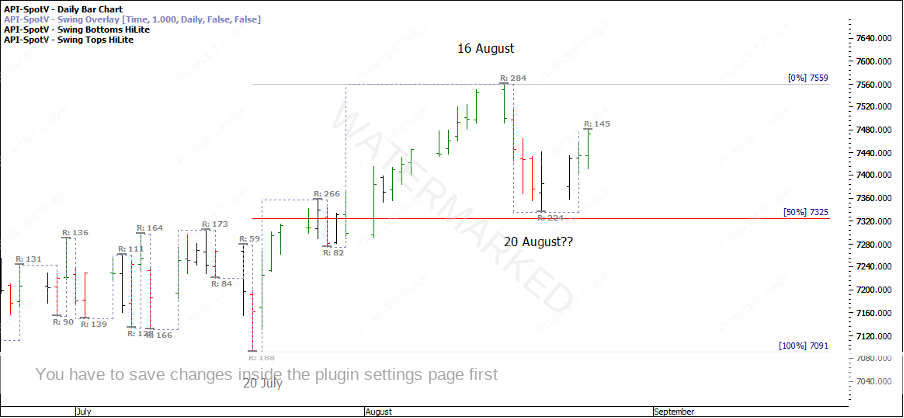
However, looking at a current daily swing chart I’m still seeing expanding down swing ranges and contracting up swing ranges.
Chart 5 – Daily Swing Chart
So, this brings me back to my point before that I don’t have to be right and know what the market is doing all the time. I was watching a cluster that the market has now pulled back from, but the swing charts aren’t quite lining up for me to take a trade that I feel has a high chance of a good RRR of 10:1 or more.
For now, I’m happy to have a break and just check this market once per day and wait for a clear trading signal. Again, all the best to those affected by COVID lockdowns.
Happy trading!
Gus Hingeley
