Cycles in Crude Oil
Hello and welcome to the Platinum newsletter for August 2021. For those that are still in lockdown around the country and around the globe, I send my regards as it is certainly starting to grate on most people’s day-to-day lives. That being said, it has hopefully provided, as I have previously said, some extra time for you to start to research further in your chosen market or even branch out into new markets.
The backdrop of global financial markets continues to show unexpected strength against what has been a true global market shock. Recently we have seen the rise of political tension and physical war in Afghanistan. These shocks can play out further across all asset classes, as I discussed in last month’s article the value and power that the US dollar holds over the global framework continues to hold true (at least for the foreseeable future).
If we look at asset classes like shares, we have seen this asset class triple in value since the last major correction in 2008 and double since the pandemic lows in 2020. Potentially based upon the fundamentals they look overvalued or stretched in terms of their movement. This is where we can lose connection to the underlying or real economy. We can see markets as Gann said go far higher or far lower than what people believe is possible. Bitcoin is another great example of a market doing much more than what the community expectation was for it.
Commodities markets have moved exceptionally well in the last 6 to 12 months and Australia has benefited directly through iron ore prices primarily. If you’ve been travelling, particularly in Sydney recently, you may have noticed the price of petrol. Thankfully we are filling up our car less, but prices have risen dramatically to offset the reduced demand.
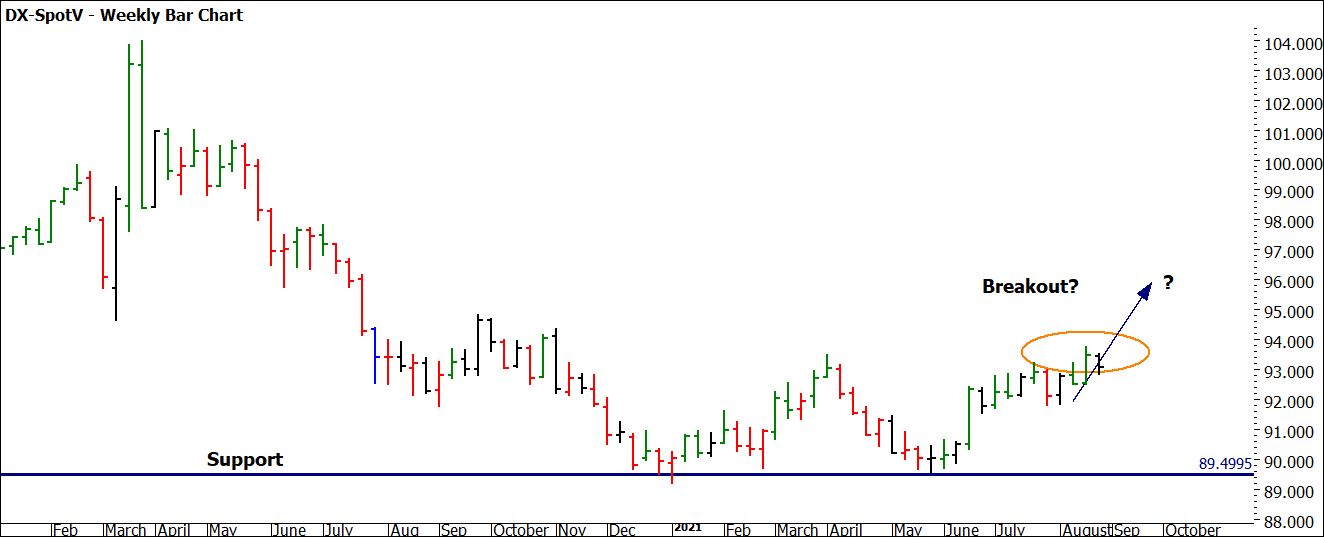
The question we might ask at this stage regarding commodities is, can this boom continue given the potential for consumption to reduce? Over the coming 6 to 12 months as government stimulus is soaked up and potentially declines will we see an impact on the real economy? Other factors include U.S. dollar pricing, which impacts the value of commodities without necessarily an underlying shift in supply and demand. Chart 1 shows the US Dollar Index position and potential for a breakout?
Chart 1 – Weekly Bar Chart DX-Spotv
For our technical discussion today, I wanted to focus on cycles that I have been watching now for several years in the oil space. This aligns to the broader market cycle studies that Gann/ David spoke about. The oil market is a fantastic market to study long-term cycles on, as we have all the data available to us as we know that the modern version of oil price trading via futures commenced in 1983 on the New York Mercantile Exchange, or Nymex. This allows us to feel confident with the data that we have and ensures that we’re capturing start and end points accurately.
Master Time Cycles look at the small and large as the same thing, we break the circle down into percentages to then understand minutes, hours, days, weeks, months and even years. The 10th year and 1st year of each decade align now in terms of position. To understand where we are in 2021, we need to understand where we’ve come from in 2020 and then that allows us to also leverage against patterns that existed in 1990/91, 2000/2001, and 2010/2011.
I will leave you to create the charts but the pattern I am seeing that has relevance is that with the Zero year of each decade 1990, 2000, 2010 and 2020 there has typically been a turn of significance in the March/April/May area depending on how you wish to define major turns. Then we add in the years ending with a 1 (1991, 2001, 2011 and 2021) and see that October and November will be places where we may see some activity again (particularly lows).
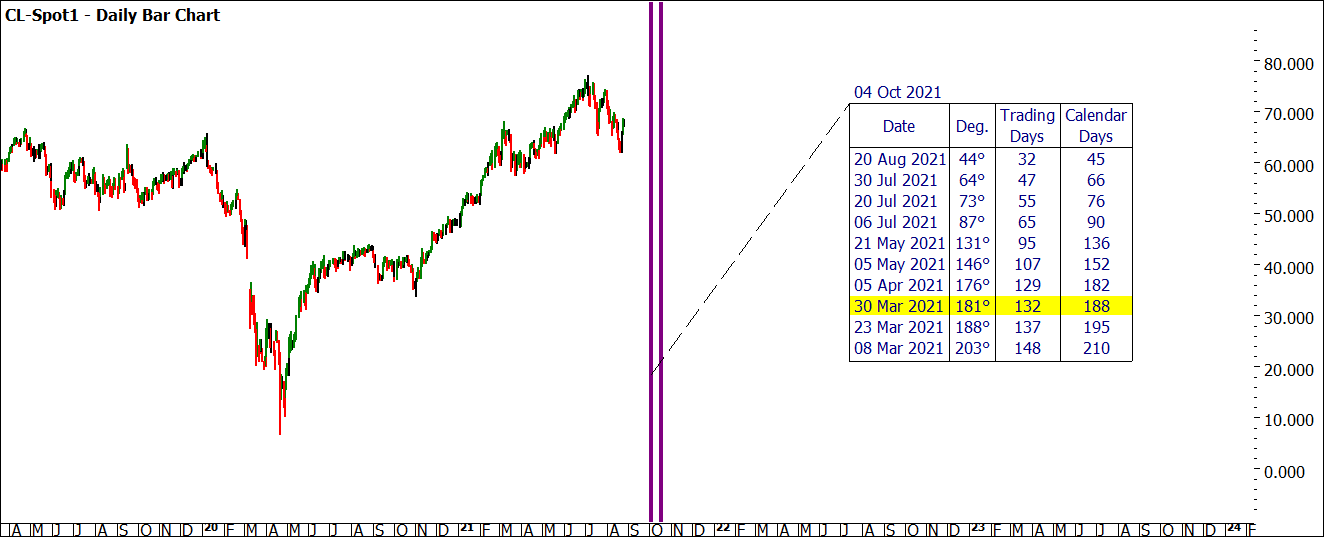
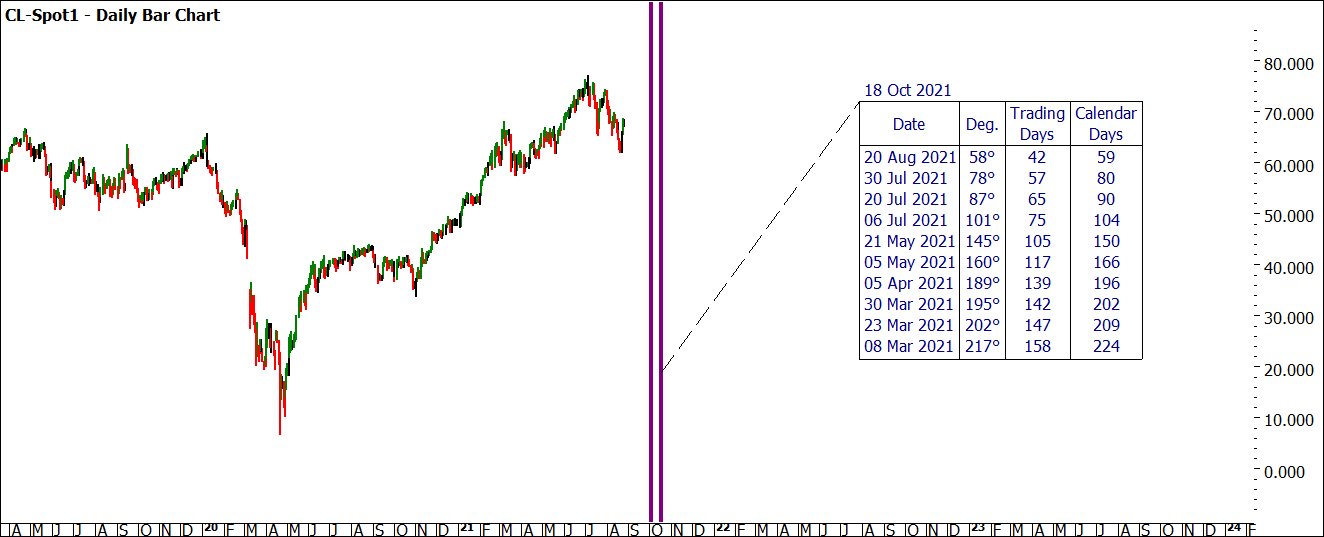
I would suggest that you calculate the length of these cycles as outlined in the Ultimate Gann Course as they will assist with understanding some numbers of merit. If we then follow this through to create some zero dates, then we see the early part of October/November (4th) and the middle of the month (18th /19th) standing out as areas to focus on.
In the next two charts I have set up these dates as potential zeros and then we can work back from them. I have used the Quick Count Tool in ProfitSource to count between turning points on a weekly chart. Whilst I always perform the calculations manually to check, its is handy to see what road you are heading down.
Chart 2 – Daily Bar Chart CL- Spot1
Chart 3 – Daily Bar Chart CL- Spot1
The challenge now is to see how you can combine perspectives in terms of the small and big picture to see if you have something to hang onto. Of course, the market will tell the story, the next weeks are critical in terms of commodities prices as to what next year might bring. The beauty of cycles is that we can view them backwards and also look forward. David’s Rating the Market lesson is providing some key insights currently to the oil market so for those looking to apply that knowledge in real-time to this market, this may be a good one to examine.
Good Trading
Aaron Lynch


