Sugar with That?
If you think about your last trip to the café, and what you brought there, it could have easily been something from one of the last few monthly SITM articles. Did you buy a coffee? Did you buy something with wheat in it? Was there sugar in either or both? In other words this month we will simply continue with the theme of the commodities.
It’s been a while since we took a look at the Sugar market – one of the big movers in the soft commodities sector. There were a few example trades in the commodities sector worthy of a spot in this month’s newsletter, but the example for sugar was a very good one. Why? Because it demonstrates the benefits of keeping it simple.
- Stick to your Price Forecasting routine.
- Use the bigger picture turning points.
- Take a definitive and standard entry, then patiently manage the trade in a simple way.
Let’s take a look…
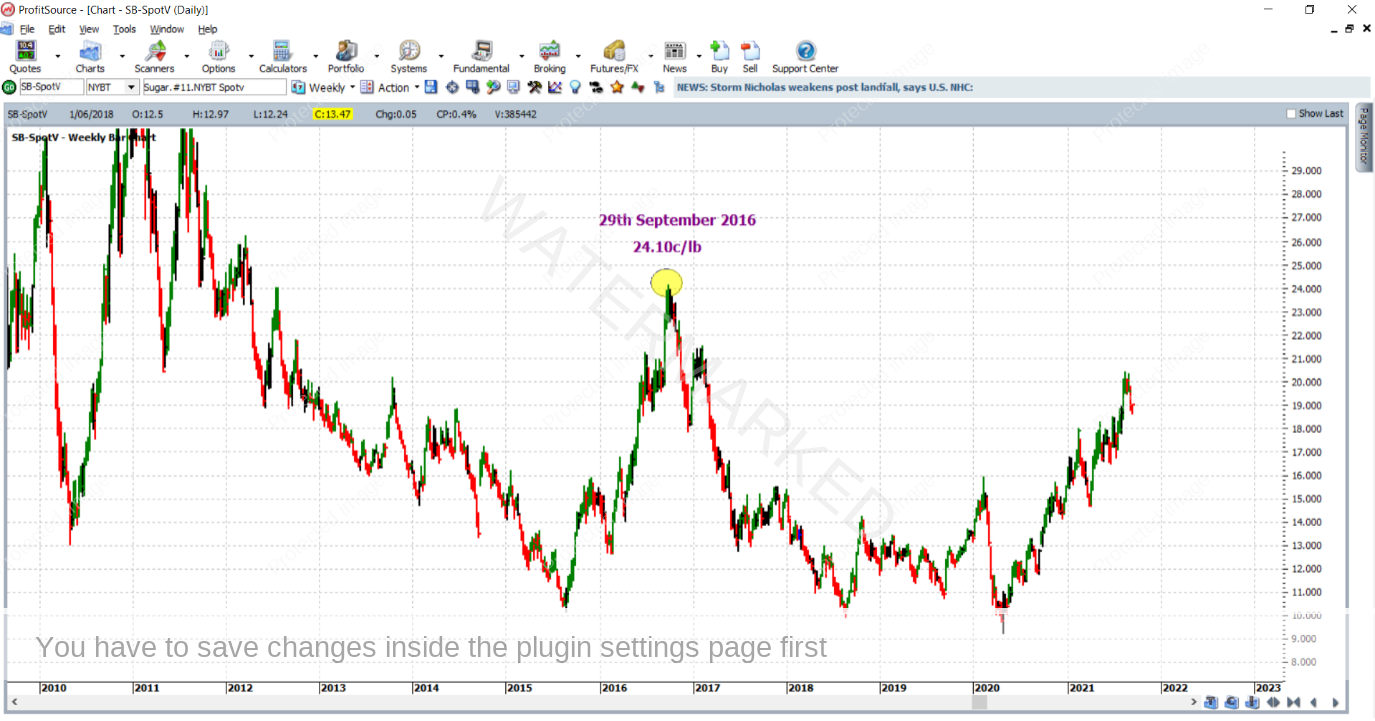
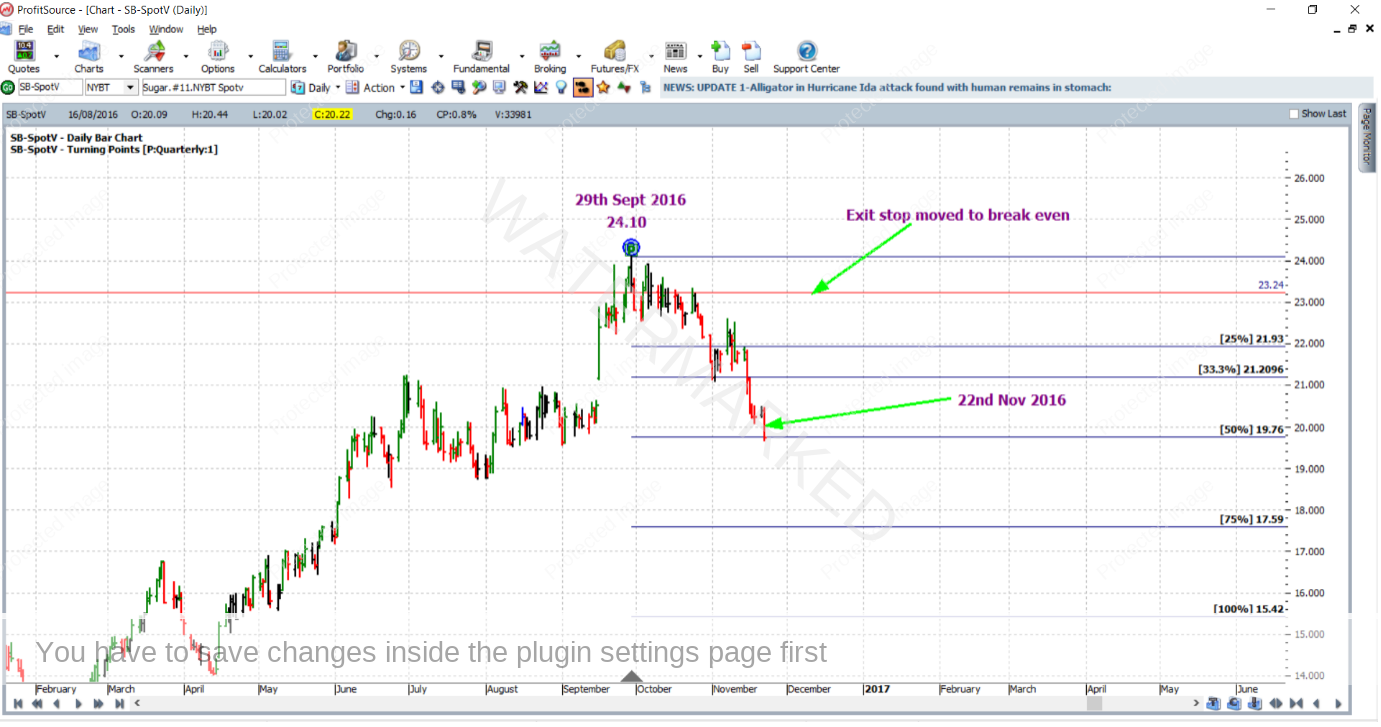
Back in September of 2016, the Sugar market put in its top for the year at a price of 24.10 cents per pound. The top came in on the 29th of September, and it was a very significant top. As you can see it is clearly visible on the weekly chart below (ProfitSource chart symbol is SB-SpotV).
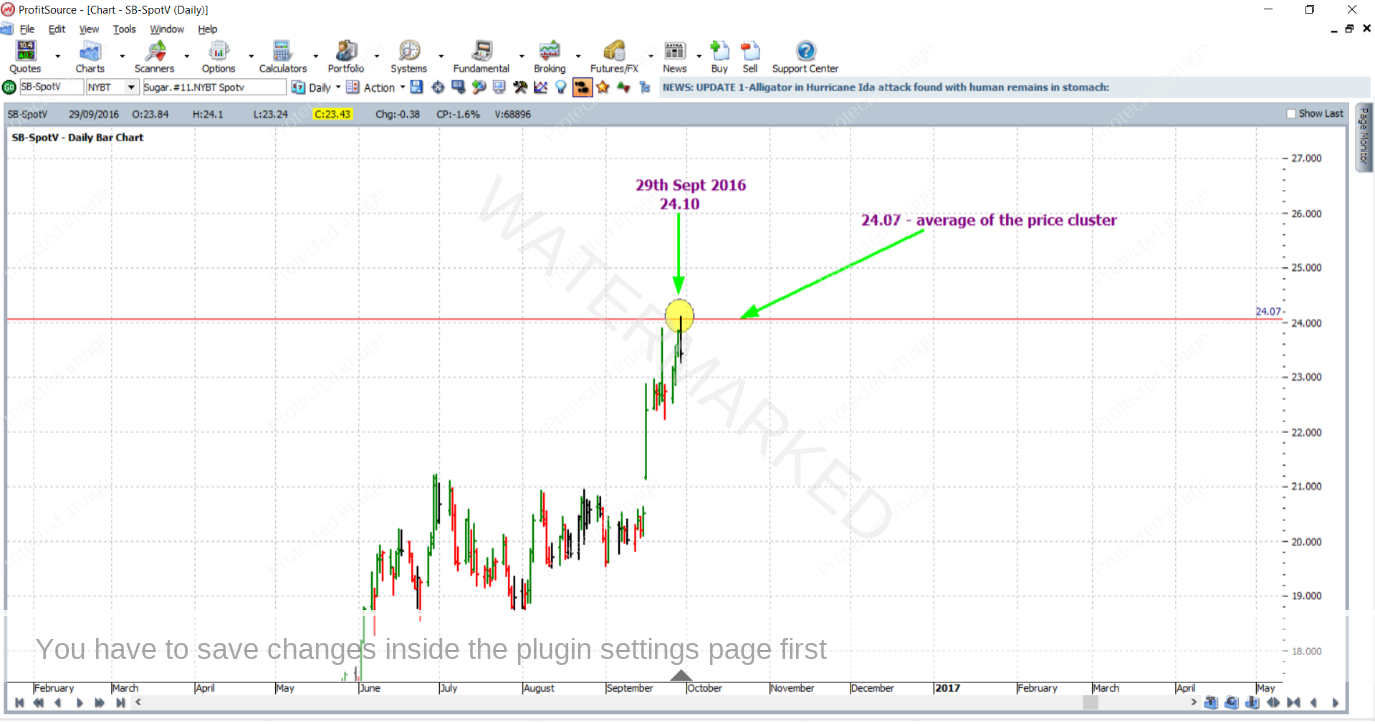
So was it possible to call this top in advance using your Price Forecasting skills? That part of course is up to you to decide. Open up a fresh bar chart of the Sugar market. Make sure that your data history is as full and complete as possible. Hit the plus key a few times to ensure that you engage turning points from the big picture. This article considers three solid price reasons, all very close to one another. All are from a variety of Price Forecasting tools. And they averaged out at approximately 24.07. Think major turning points. Think of important milestones and resistance levels.
As you can see below in the chart in Walk Thru mode, the eventual top itself only broke the cluster’s average by 3 points – a very small amount in relation to the average size of a daily bar in this market.
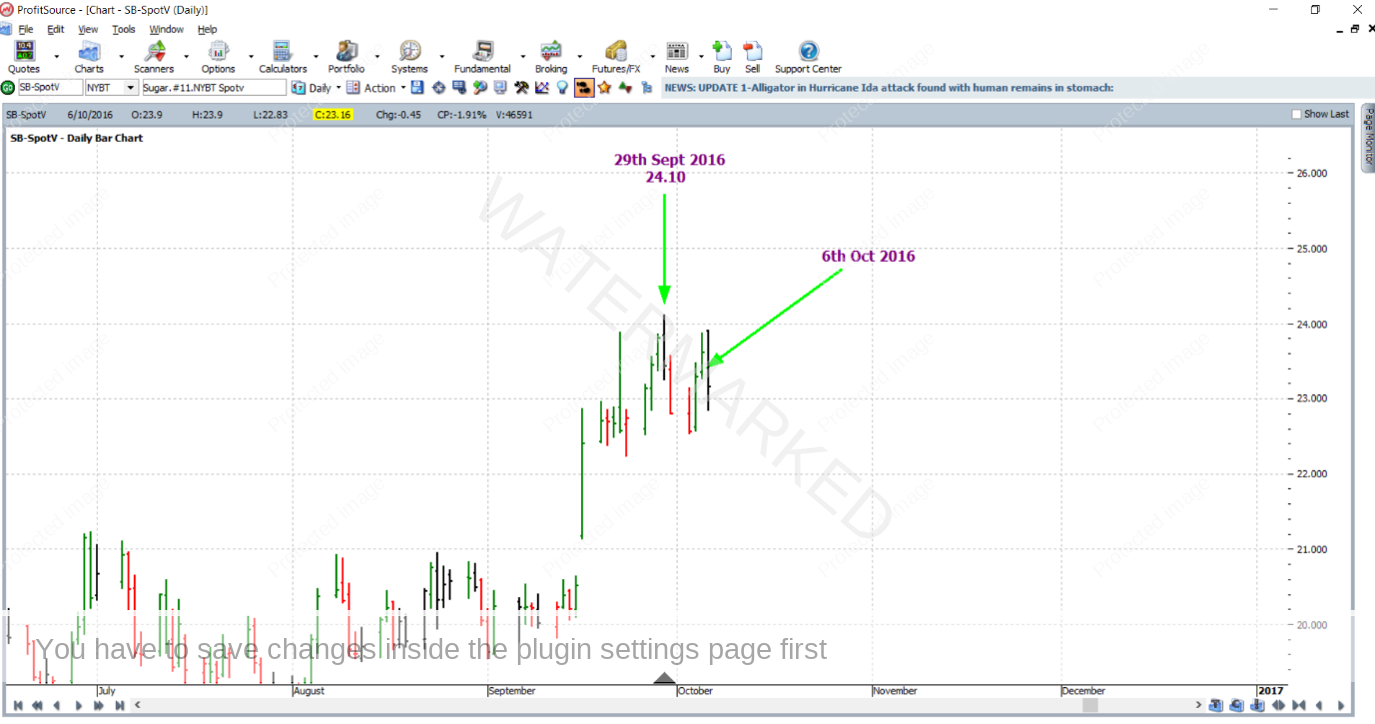
After using our skills from the Number One Trading Plan manual to identify the price cluster, we go to another part of the same manual for the details of an entry signal. In this case it’s the First Lower Swing Top. In our example trade, this entry signal was triggered on the 6th of October 2016 at a price of 23.24, with initial exit stop at 1 point above the “good outside day” which the entry day itself was, at a price of 23.91;
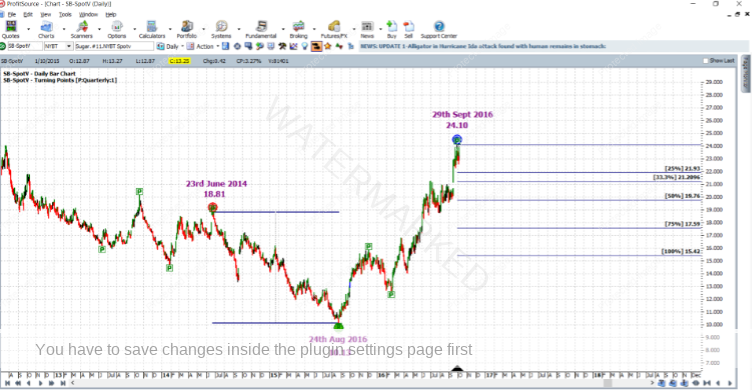
As for choosing a reference range for the exit target, let’s consider one of the last quarterly swings in the same direction as our trade. This is shown in the chart below, with the use of the Quarterly Turning Points Hi-Lite, and a very large application of the ABC Points Pressure Tool. Point A was the 23rd of June 2014 at 18.81, Point B was the 24th of August 2015 at 10.13, and of course Point C was the 2016 top. There were two good reasons for choosing such a large reference range: to achieve a high Reward to Risk Ratio, and the fact that the price cluster was a strong one. For this reason the smaller Quarterly Swing which you can see below between Points B and C was not used.
From here on, let’s manage the trade like it is an ABC trade managed Currency style. On the 22nd of November 2016, the market finally reached the 50% milestone. Yes it was a long wait. And it was a choppy ride on the way down, especially as far as the daily swing chart was concerned. Exit stops were moved to break even.
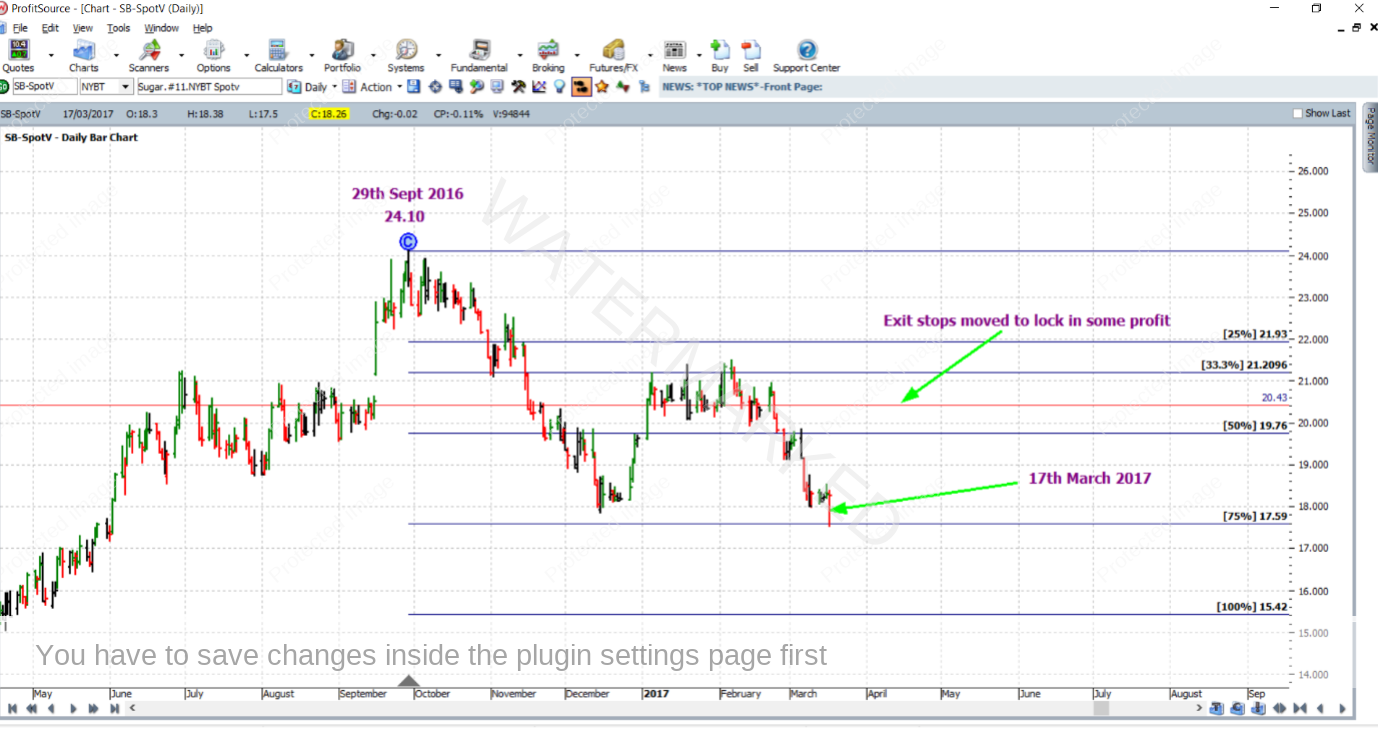
On the 17th of March 2017, the market tagged the 75% milestone and exit stops were moved to lock in some profit at one third of the average monthly range (approximately 67 points) above the 50% milestone, to 20.43;
Reading this article, it probably feels like this all happened very fast. But note the time scale. The trade has so far unfolded over the space of several months. At times the unrealised profit would have been up, it would have been down. Emotions? Even for the most astute trade, emotions would have been there tempting them to abandon the trading plan. That’s where it takes patience and discipline. Explosive and fast-moving trades are great when they are there. Some of them however will take their time and do the grind!
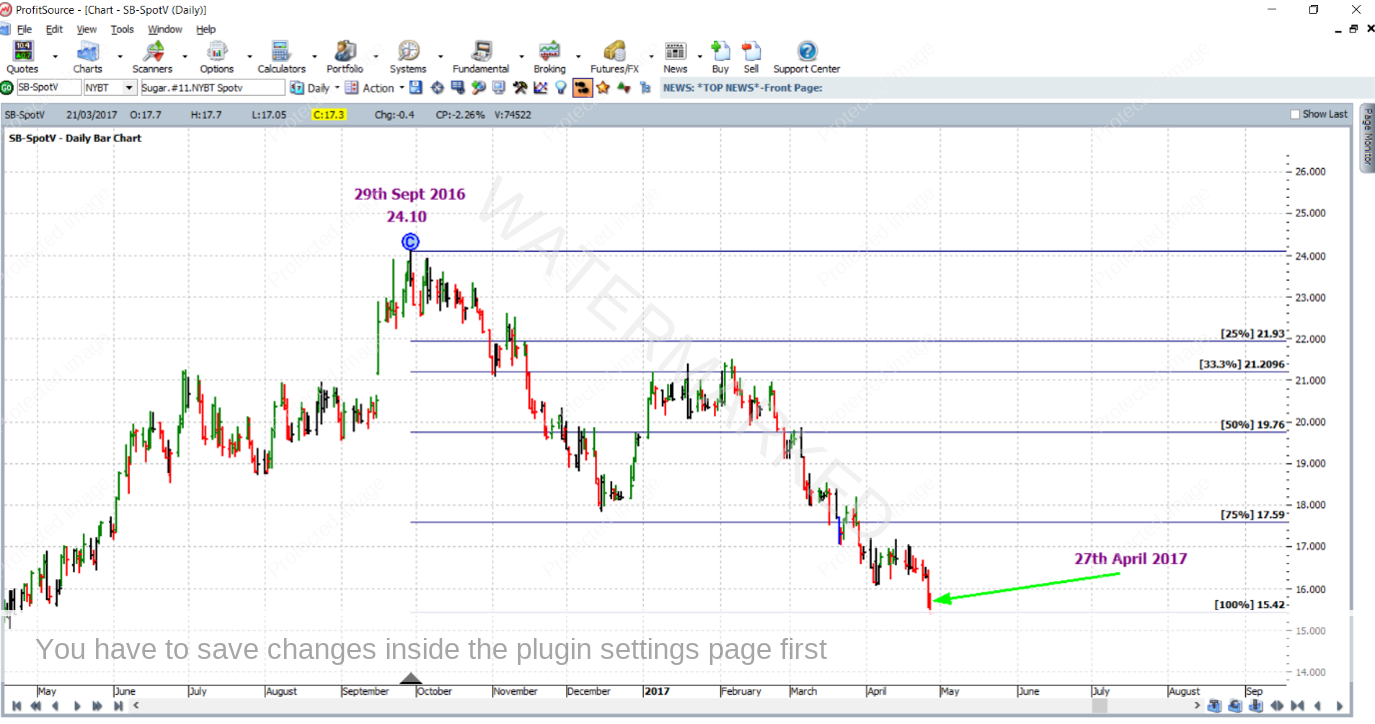
And as you will see below, patience was finally rewarded when profit was realised at the 100% milestone of 15.42 on the 27th of April 2017.
Now to conclude, let’s do a detailed break down of the rewards. The Reward to Risk Ratio:
Initial Risk: 23.91 – 23.24 = 0.67 = 67 points (point size is 0.01)
Reward: 23.24 – 15.42 = 7.82 = 782 points
Reward to Risk Ratio: 782/67 = approximately 11.7 to 1
The specifications on the ICE website will say that each point of price movement changes the value of one Sugar futures contract by USD$11.20. Therefore in absolute dollar terms the risk and reward in US Dollars for each trade of the contract is determined as follows:
Risk = $11.20 x 67 = $750.40
Reward = $11.20 x 782 = $8758.40
In AUD terms at the time of taking profit, this reward was approximately $11,725.
Taking the standard risk of 5% of the account size for this trade, the resulting positive percentage change to the account size after taking profits would be calculated as:
11.7 x 5% = 58.5%
There are brokers who will make this market accessible via a CFD, whereby much lower minimum position sizes are available, making it accessible to those entering the markets with a lower account size.
Work Hard, work smart.
Andrew Baraniak
