Big Picture Cycles
I was fortunate to find David and Gann earlier in my adult life compared to some, including David, who was approximately my age now when he started his journey. I recall the discussions on data and research and the value of having as much historical data as possible. A long time back then to me was 12 months, now time seems to pass at a rapid rate as we are closing in on the end of 2021 a year most will be happy to see the end off.
I am somewhat reminiscent of this month and year, as it reminds me of the years 2000 and 2001 as I was starting out with Safety in the Market and seeing the real-world applications of what I was reading in the paper and in textbooks. Time cycles repeating and the value of big picture cycles, a day, week, month, or year are just parts of a bigger picture. They can all be measured the same way and with enough hindsight can become foresight if used often enough.
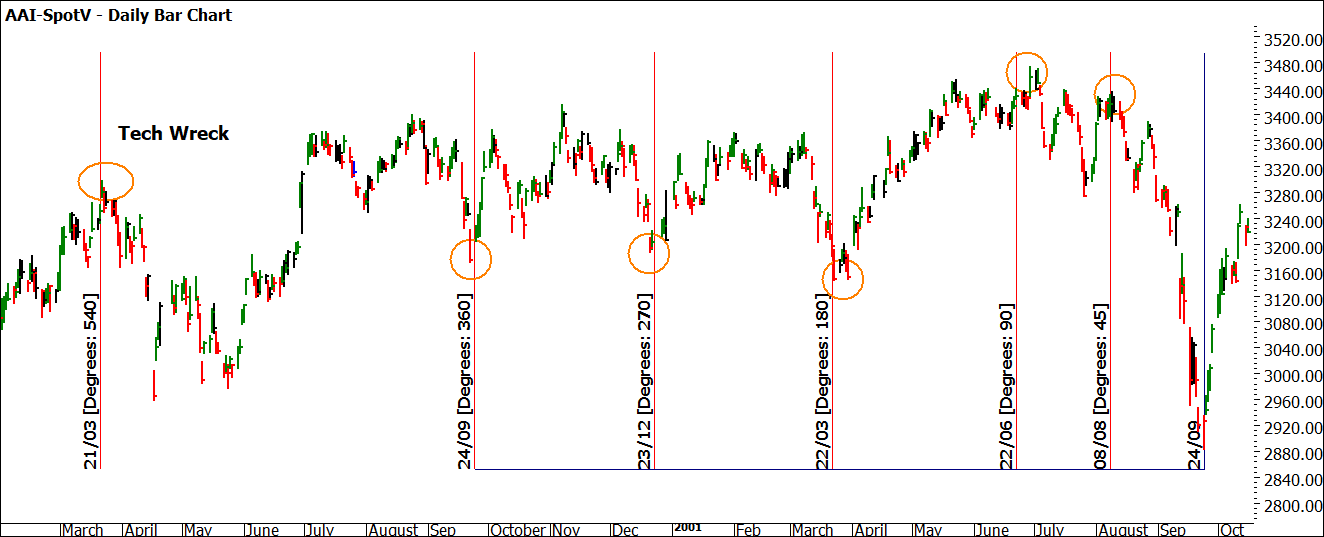
It didn’t get any more real-world for me than being in Adelaide on the 21st of September 2001, having just finished a seminar with some old colleagues and new students. The buzz in that room on that day is one I won’t forget as the notion of a bottom was the talk in the SPI and this was hard for some to fathom as we had just witnessed the 9/11 attacks that as we now know changed the world forever. The use of Time by Degrees had picked up turns every 90 degrees leading into this seasonal date and formed what is likely still one of the best textbook examples you could write about.
It’s interesting that we see 20 years later the withdrawal from Afghanistan and subsequent market rumblings 20 years on. So it’s with an eye to the past and to the future that nostalgia, as much as anything, draws me to write about the SPI 200.
Chart 1 shows the patterns leading into the September low of 2001. I recall discussing how the Tech wreck high of 2000 and the low in 2001 were connected but for those outside the world of Gann, they find the connection hard to correlate. I also find it interesting to say I have now lived long enough to watch a 20-year cycle of a major event start and potentially repeat.
Chart 1 – AAI-Spotv Daily Bar Chart
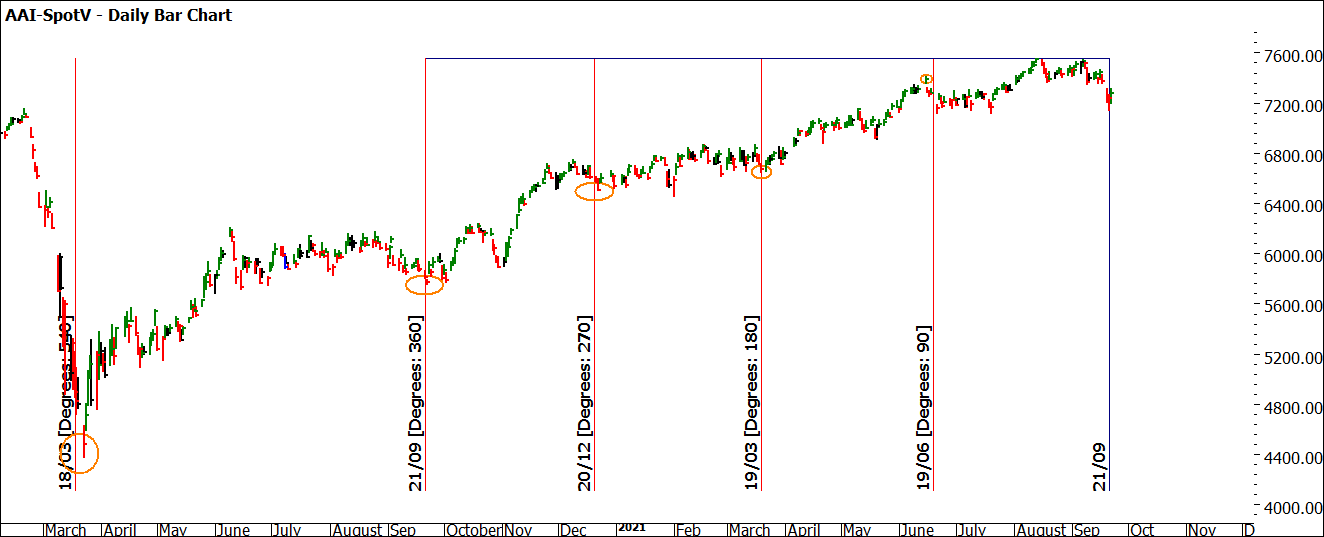
Chart 2 whilst not exactly the same, does provide some interesting similarities for the trained eye as we see Master Time Cycles as well as Time by Degrees providing some insights to the current market.
Chart 2 – AAI-Spotv Daily Bar Chart
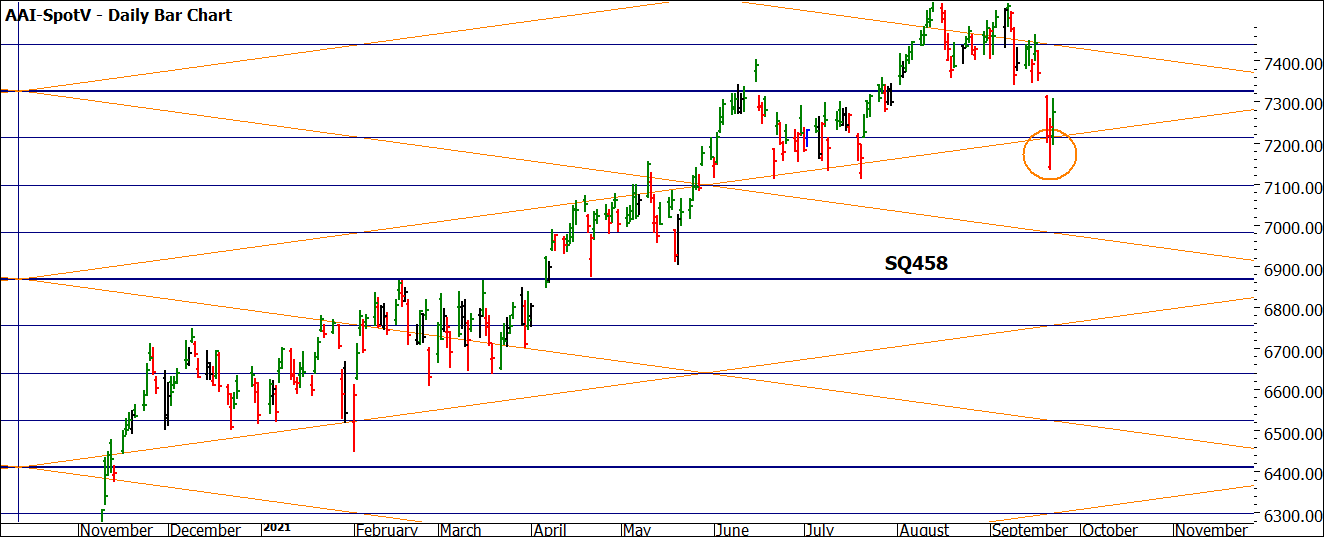
As I write, the global markets have made some recovery north overnight and the “vibe” feels very similar to what I recall from 20 years ago. No one will ring a bell at tops or bottoms so we must be prepared for all eventualities. The All-Time Lows square on the SPI (458) continues to provide excellent insights to the current market. Chart 3 shows the current position.
Chart 3 – AAI-Spotv Daily Bar Chart
I would also encourage you to analyse other squares including the market square of 4372, the low of 2020. The interesting aspect for me is that the low of 2020 at 4372 and the low yesterday 22 September 2021 was 7132.
7132 – 4372 = 2760 or approx. 6 multiples of 458.
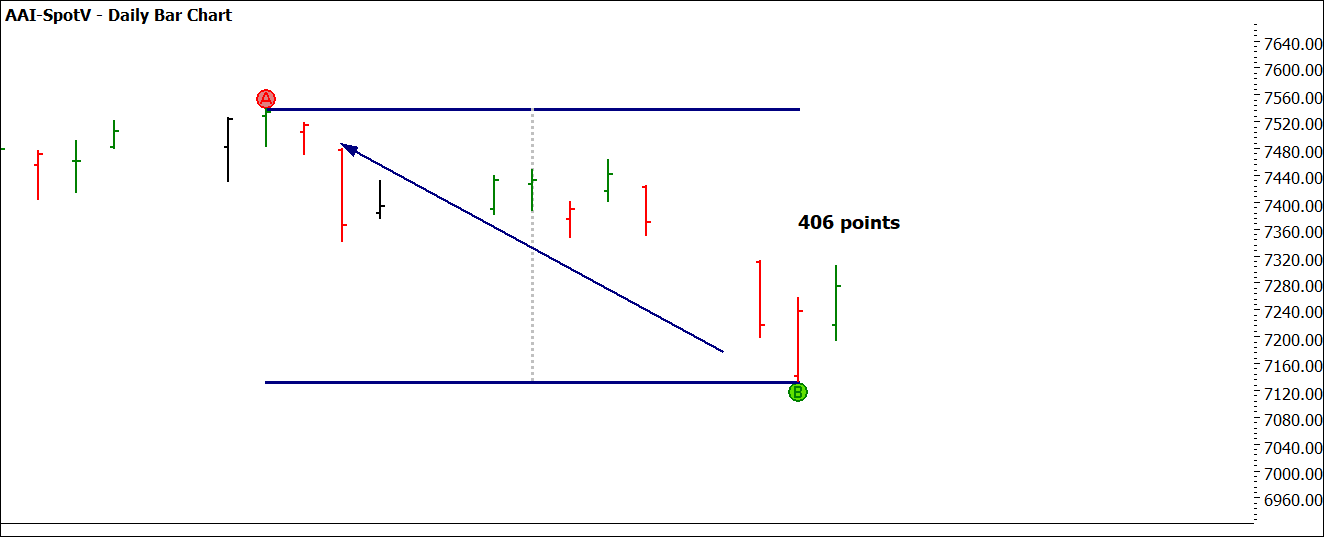
Another prime number of the SPI to measure currently is the run down in points from top to bottom (A to B ) in Chart 4 of 406 points. Can you see this occurring in any other ranges?
Chart 4 – AAI-Spotv Daily Bar Chart
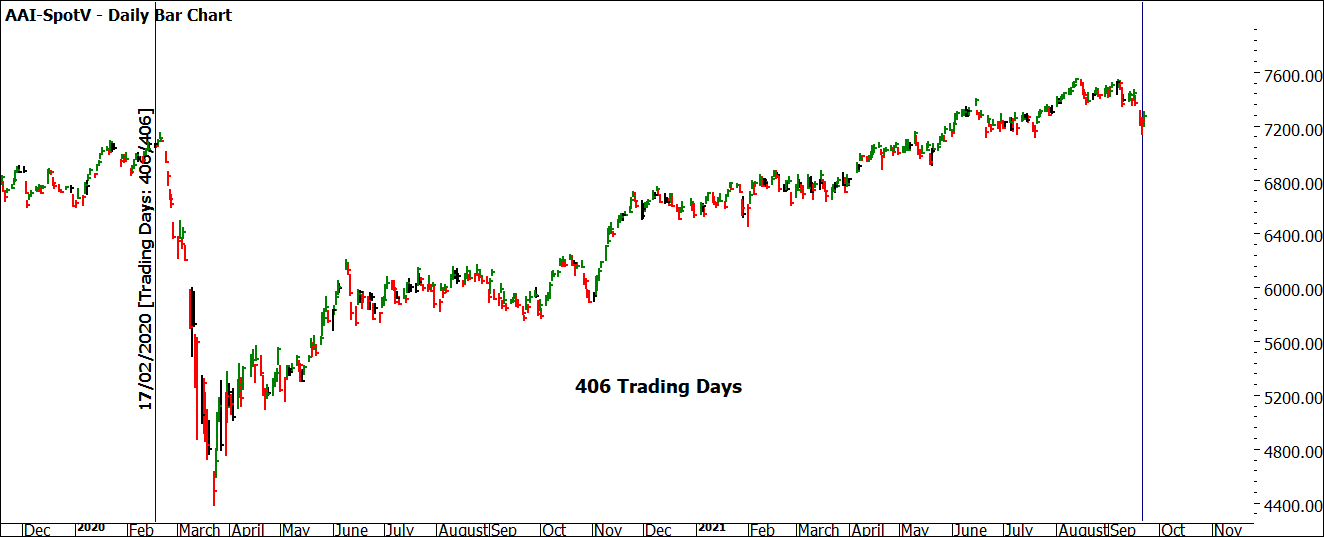
As we know with prime numbers, we should feel comfortable to use them in a variety of ways. Given that we have 406 points, we can also use 406 in time. Chart 5 gives us some interesting areas of symmetry if we run back from the current low 406 trading days. I would encourage you to see what other time frames offer some harmony.
Chart 5 – AAI-Spotv Daily Bar Chart
There are many other relevant tools we can apply to look for harmony in this current phase of the market. The Square of 9 as an example, shows us 7132 is close to 7140, a relevant area of the Ordinal Cross.
This all means very little if we are not able to take advantage of any moves, so a trading plan is critical. If I cast my mind back, the confirmation of gaps in the range being closed was a pertinent strategy 20 years ago, it may again prove useful in 2021 as we see a gap on the daily chart between the 17th and 20th.
Whilst this market does not sit as a prime market for me in terms of day-to-day interaction, I am excited to realise that the work I have previously undertaken, and a strong foundation of my skill set allows me to pick up my history and apply it in the current environment.
Finally, thanks for allowing me to indulge in a trip down memory lane, this article has made me feel 20 years younger!
Good Trading
Aaron Lynch
