A Shake of the SPI Tree?
Welcome to the September edition of the Platinum newsletter. At the time of writing at 10:06 am, Tuesday 21 September, the SPI has made a 489 point run down from its 16 August top of 7559 to 7070. Yesterday alone, the SPI fell around 2% with fears that China’s second-largest property development group Evergrande defaulting debt payment could send shockwaves through China’s economy and have flow-on effects globally.
One of the key pillars to a Classic Gann Setup that David teaches us in the Ultimate Gann Course is volatility. So, could the news and market reaction in the past days be the volatility needed at a Time by Degrees date at the end of a run to shake a few traders and investors, then head in the opposite direction?
A quick look at the stocks that make up the ASX top 20 shows that the major contributors to the current sell-offs have been the miners on the back of a slide in the Iron Ore price that has seen the commodity fall around 55% from $230 per ton in May 2021, to the current price of $104 per ton.
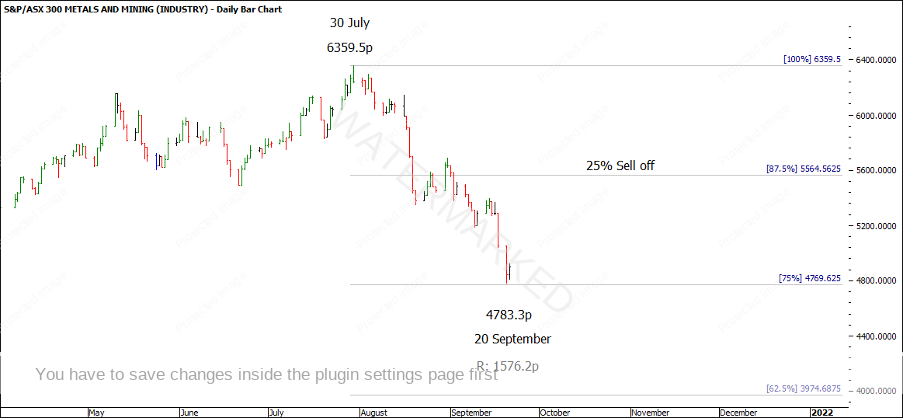
Comparing the different asset classes, a quick look at the Metals and Mining index (XMM.ASX) shows the current sell-off has been about 25% from its 30 July high.
Chart 1 – XMM.SpotV – Metals and Mining
Still, you can only trade on what the market gives you, and overnight, the SPI has provided us something of interest to analyse.
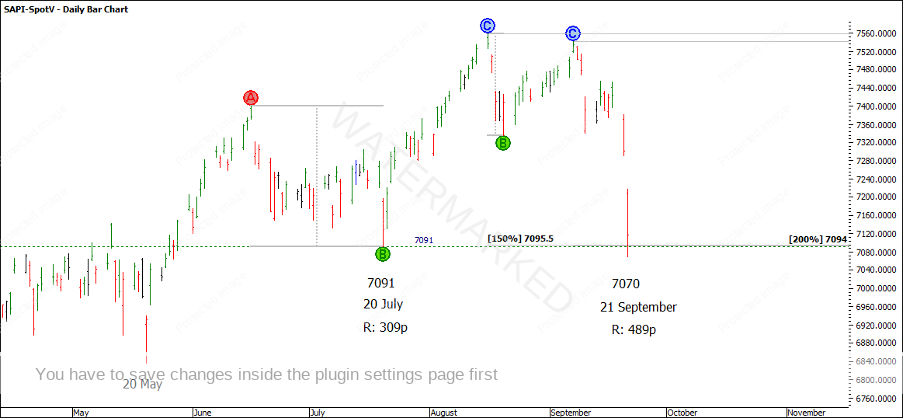
Looking at the year to date, the Yellow and Red Time by Degree dates have been the most useful with the majority of tops coming in around the 15th to 16th of the month and most lows coming in around the 20th to the 21st. In Chart 2, I’ve used the SAPI-Spotv which is the night-only market chart as the API and AAI charts won’t update until the end of the day. Still, the numbers in the SAPI are very similar to the API.
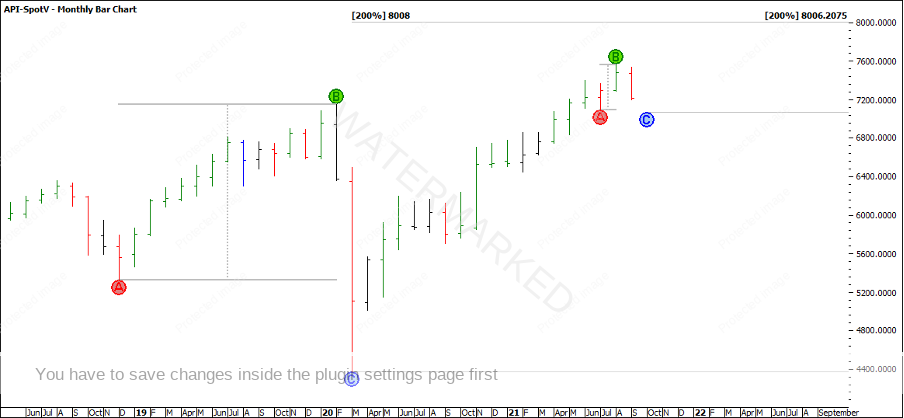
In the wee hours of this morning (21 September), the SPI has presented a double bottom set up on the monthly swing chart. I will let anyone reading this go and apply their favourite techniques to see if this is a worthy Classic Gann Setup or not. Although in Chart 2 below, I have given you a head start.
Chart 2 – SPI Double Bottom
It’s a good idea to be watching all the different SPI charts, as the API rolled over into the December contract on the 15th of December. We can also look at the API-2021.Z chart and its ranges where you may also find another reason for a low around 7070.
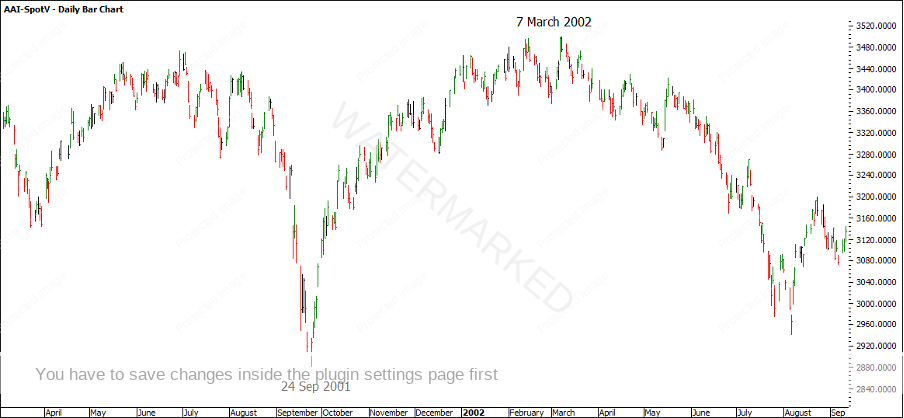
Interestingly on the larger time frames, it is within 3 days of a 20 year anniversary of the 24 September 2001 spike low following the September 11, 2001, terrorist attacks.
Chart 3 – SPI September 2001
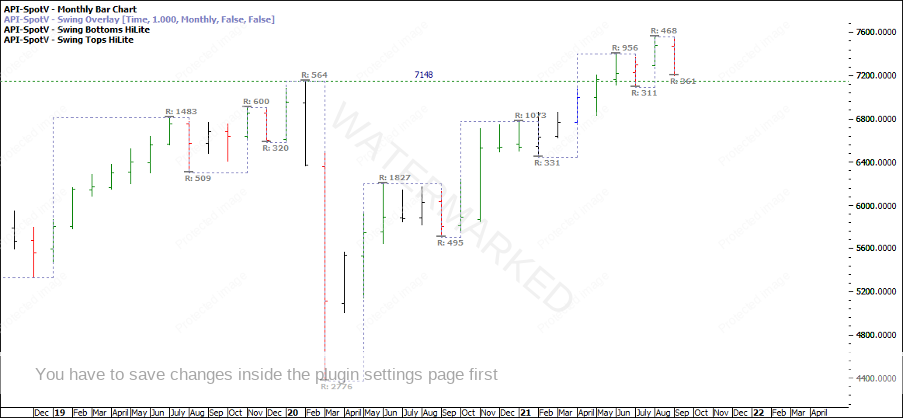
One thing I note about the SPI is that the double bottoms have formed on the 20 February 2020 COVID top (7148p). But the SPI is showing contracting monthly swing ranges up and now an expanding swing range down. So how could you rate the strength of contracting swing ranges up and now an expanding swing range down?
Chart 4 – SPI Monthly Swing Chart
My take on this is considering the double bottom is holding on to a previous All-Time High, it could well be the key to the market direction. If the double bottoms are broken, then the old 7148 top is no longer acting as support and the August top may possibly end up being a quarterly swing top. However, if the Double Bottom holds, then we can expect more upside and apply our ABC ranges and David’s 200% Double Bottom rule. Straight away I see 200% of the potential monthly double bottom clustering with 200% of the Quarterly swing range around 8000 points.
Chart 5 – SPI Cluster
The SPI has started to rally and the 4 hour First Range Out is now currently 216 points. With a price target of 8006, that would give a range up of 938 points or a bit over 2 multiples of 458. That provides us with a good chance of getting in with a low risk to make a good 10:1 RRR or larger.
This could be a great example of watching a double bottom unfold and stalking entry points on the way up. Remember the SPI can and will do whatever it likes, over the past 18 months we’ve seen plenty of fairly flat sideways periods followed by short bursts of trending market, so always be prepared for a move in any direction!
Happy trading,
Gus Hingeley
