Nasdaq Update
Welcome to the October newsletter and well done for surviving the month of September where throw-away lines abound of market crashes. Now of course it’s not to say that market declines cannot commence in the month of September, and we have seen this on more than enough occasions to be relevant, what I attempt to avoid is to make sweeping statements that are effectively generalisations that are not rules to live by but guiding blocks in what is a big puzzle.
For those that read both articles I wrote last month, they both dealt with the averages of September moves on the Nasdaq and the 20-year anniversary of the September lows in 2001. There were some signs of support on several markets as prices ran into the September seasonal date. In most cases, those lows were re-tested and pushed lower in late September or early October.
From there we have seen sideways movement and again this could be a basing pattern or a pause before we go lower. Of the years on the Nasdaq where the months were bearish as they were in 2021, the market on average lost 7.33% of its value when using the open price on the 1st trading day in September and the close of the last trading day in September.
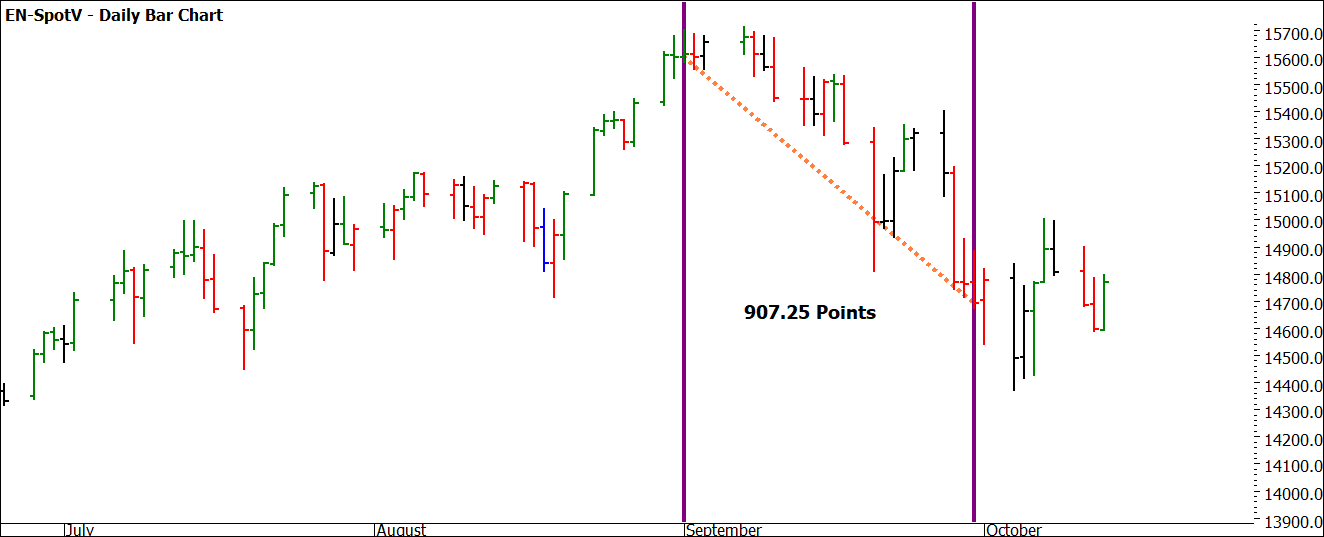
If we review 2021, we can see that indeed it was a bearish month and the decline by 907.25 points delivered an approximate 5.8% loss for the month.
Chart 1 – Nasdaq Daily Bar Chart
The context of the drop in relation to historical moves for the month and after what has been an astronomical gain in the last 18 months suggests if this is a crash-style event, then investors who have been long have gotten off pretty easy. Last month I also suggested we keep a close eye on our swing charts to help us understand the magnitude and potential for a continuation of this pullback.
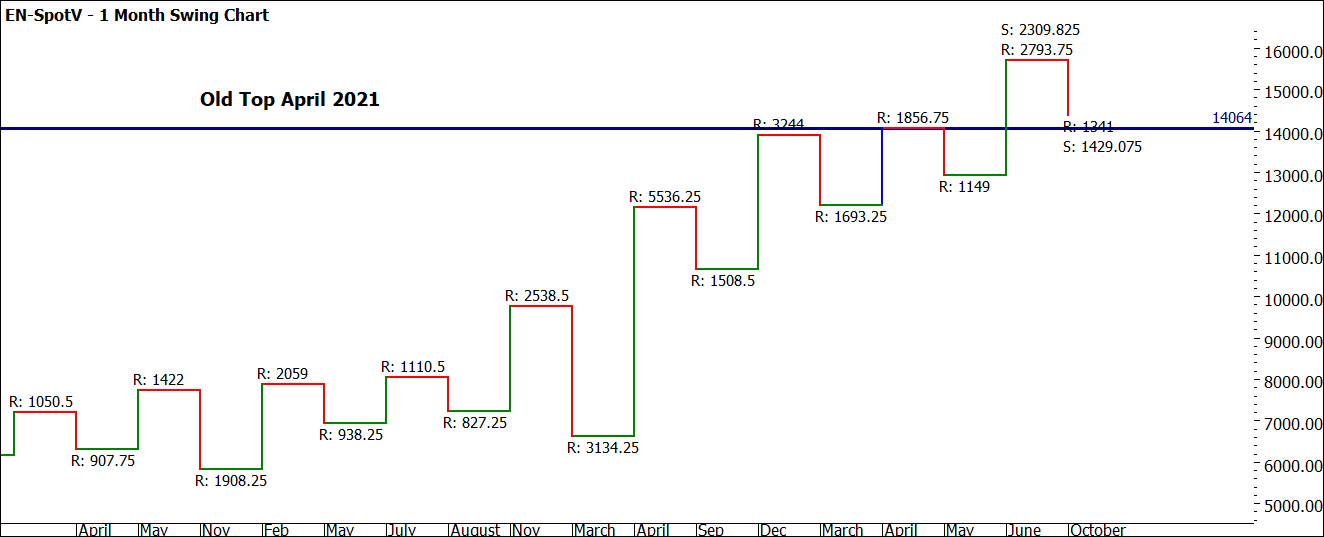
Our 2- and 3-day swing charts are confirmed as downtrends, while our 1 day is uncertain after the recent higher bottom came in around the 11th of October. The ranges did start to expand by a factor of twice the average swing on the daily chart, however, the 2- and 3-day charts are pretty steady in relation to their average swings so its hard to draw too much in terms of momentum to suggest this is a violent or considered sell-off. It would be safer to categorise it as an orderly sell-off, that, against the backdrop of the current economic landscape. So, to the monthly chart we go, to study the bigger picture. The low of April this year looms as an area to watch for support or if the level is broken then an indication of lower prices could be on the cards. The current swing down of 1341 is a number those who have studied markets more broadly may be familiar with. The average of the last 10 downswings from ProfitSource tells me the average is 1429 points, so we are well within a range of “normality” of monthly downswings.
It would be hard to argue this is “currently” abnormal or an overbalance to the downside.
Chart 2 – Nasdaq Monthly Swing Chart
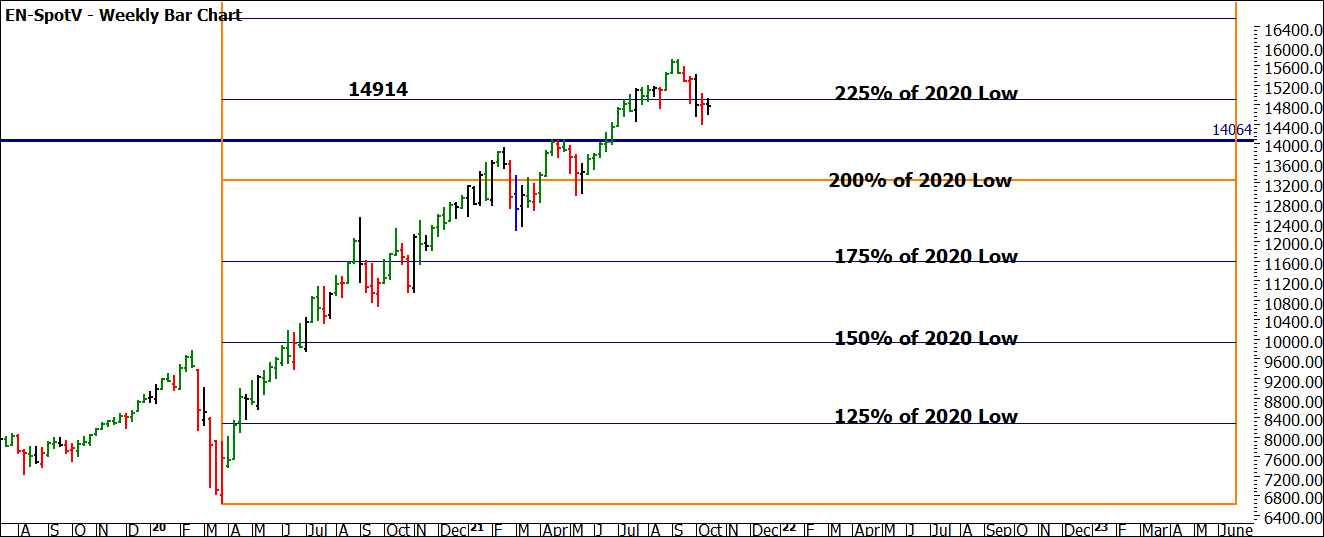
Chart 3 is the Lows Resistance Card from the March 2020 low and shows from a price perspective how far this market has moved in the last 18 months. When you consider the market has more than doubled since the COVID low the trend has been very strong.
Chart 3 – Nasdaq Weekly Bar Chart
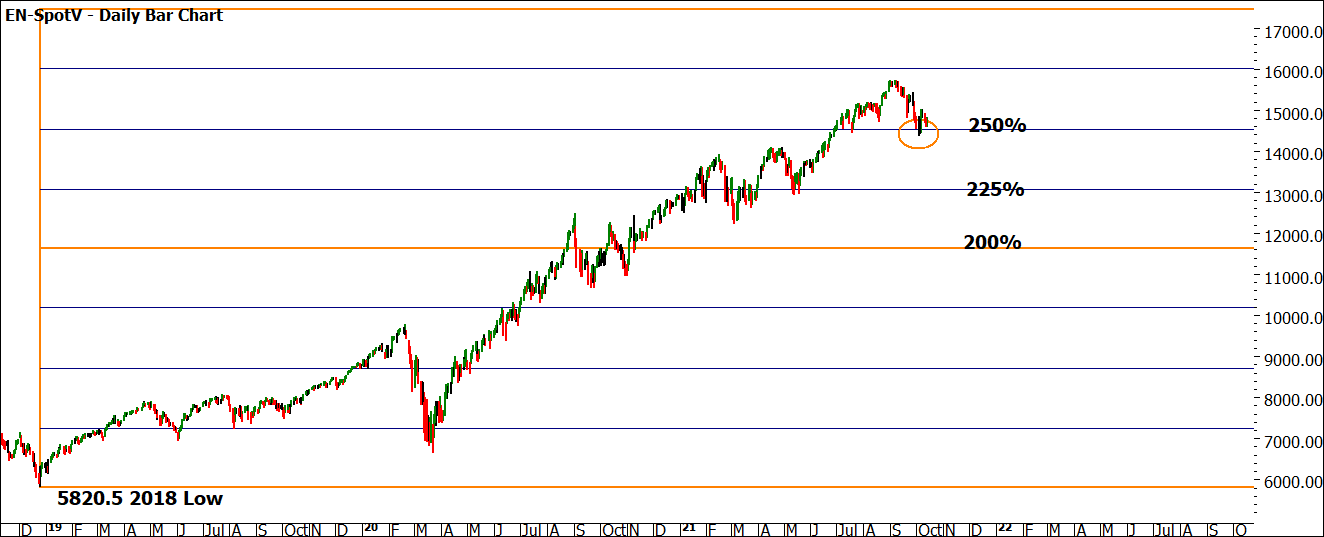
Chart 4 follows on the Lows Resistance Card theme by testing the 2018 low of December of 5280.5 we see some possible support in place when highlighting the current low in October 2021.
Chart 4 – Nasdaq Daily Bar Chart
Your challenge now will be to test other “major” lows to see if you can create a cluster at applicable levels. This allows us to place some “big rocks” down to build a trading plan around, be that long or short. By defining key levels to consider as possible support or resistance we can look for these areas to launch high Reward to Risk Ratio opportunities. Your next research task is to back-test your entries and exits from the low in May this year.
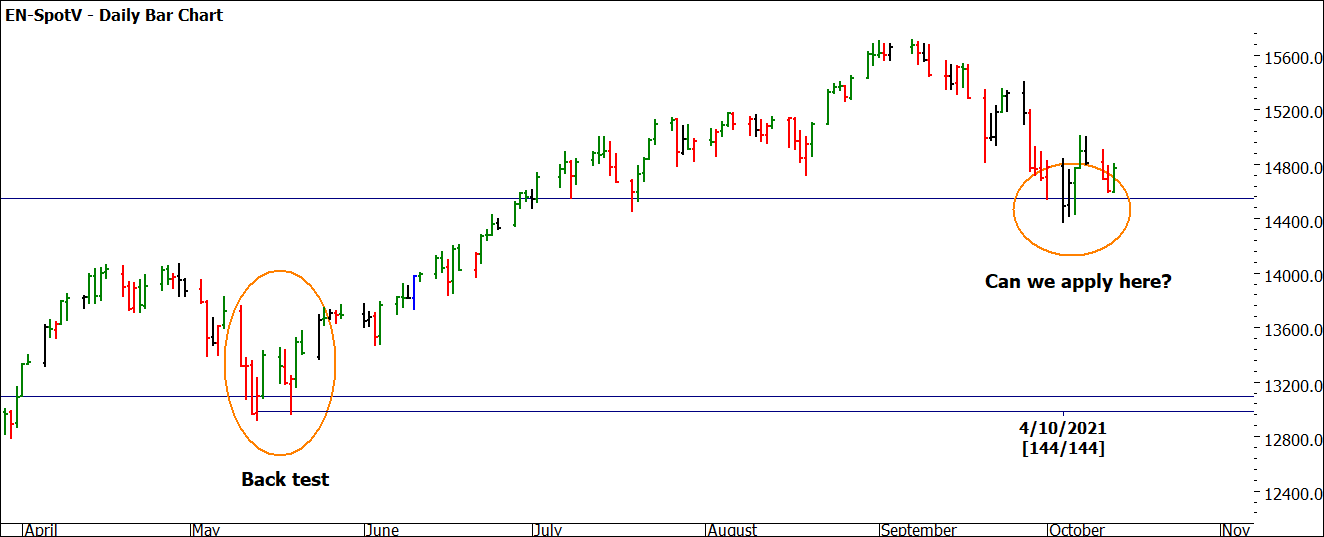
Chart 5 shows us the low in question and the long movement that followed. I have also included the current position of the market. For those looking to test themselves, how is the May low related to the October low, and what makes the current first higher bottom pattern similar?
Chart 5 – Nasdaq Daily Bar Chart
Good Trading
Aaron Lynch
