A Tricky Retest
Welcome to the October edition of the Platinum Newsletter. When I think about the different scenarios that might unfold during any potential move, I’m probably guilty of thinking we’re either going to see a good trend up, a good trend down or a tight sideways market. However, this last move on the SPI since the 21 September low has been a bit of everything in a short period of time!
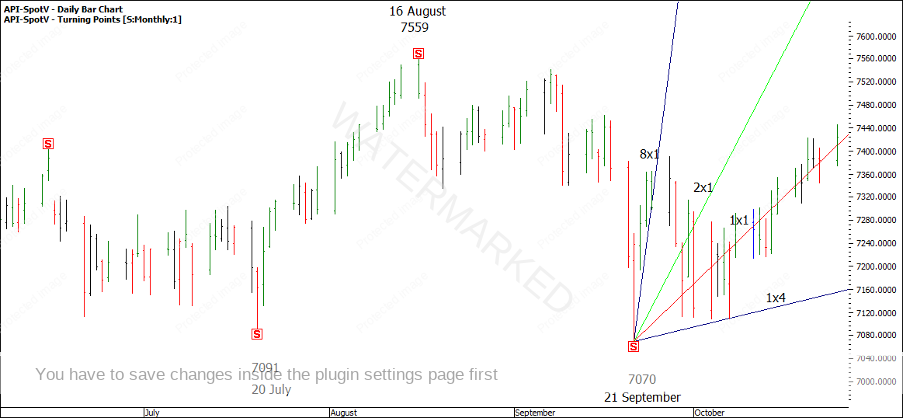
Out of the 21 September low, the first 3 days up traded above the 8×1 Gann angle (using 10 points per day) which I rated as strong and gave me some confidence that the double bottoms could hold. See Chart 1.
Chart 1 – Gann Angles
After a 2-day pullback of around the same pitch, the market just went sideways for 8 days, finally making daily triple bottoms on the 1×4 Gann angle. The SPI has now moved away and has been roughly tracking the 1×1 angle and looks to be in a second weekly section up out of the monthly low.
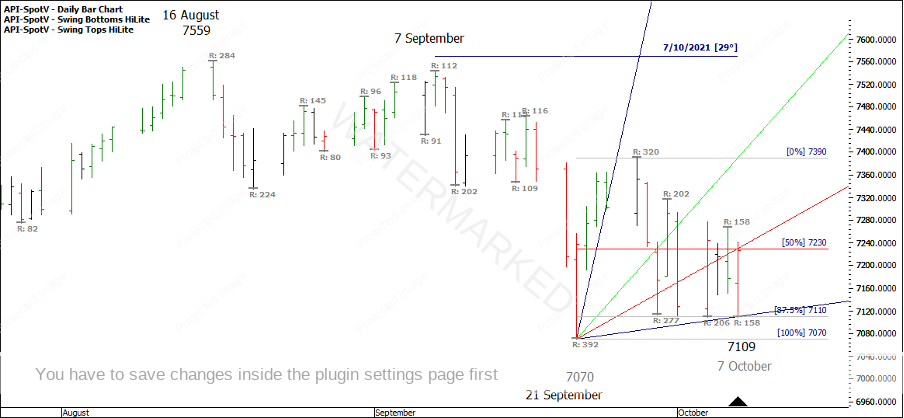
Cutting straight to the chase, in Chart 2 below, I’ve highlighted the 7 October low which is the next best starting point to get long out of. This setup shows triple bottoms with three contracting daily swing ranges into a Time By Degrees day and 30 degrees from the 7 September top resting on a 1×4 calendar day angle. 158 points down is also just over 50% of the 277 point daily First Range Out. Keep in mind that ProfitSource shows 7 October as the low, although the actual low was made on the 6th.
Chart 2 – Triple Bottom Setup
The challenge with final tops or bottoms is that they are usually very easy to identify after they have occurred but they’re not quite as easy to identify as they are unfolding because of the false signals to enter that you may see.
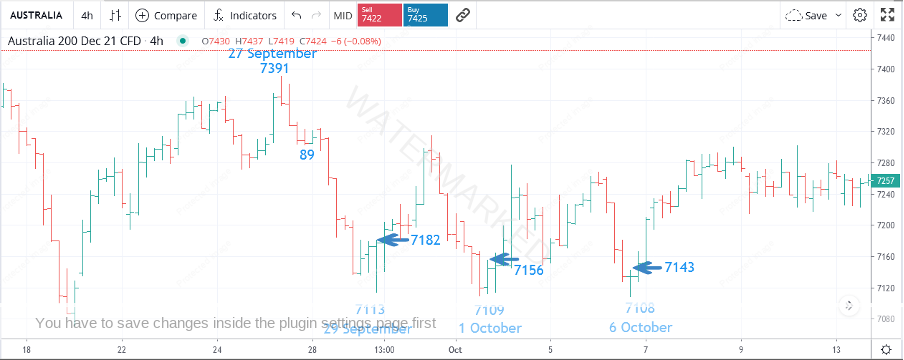
In Chart 3 below I’ve highlighted three potential times that stand out to me as places to enter the market intraday using the turning of the swing chart entry strategy on the 4-hour swing chart. As you will see, there was potential for two losses depending on your trade management strategy.
Chart 3 – 4-hour Swing Chart
The main point of this article is to not gloss over the potential entry points that may result in a loss. Identifying a cluster in time and price is one thing, but there is also a lot of skill required to not burn up too much capital trying to get set in the trade.
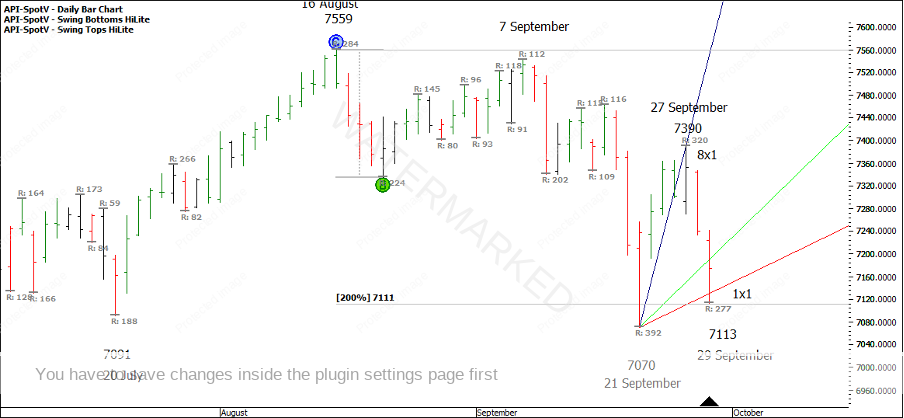
Looking at the 29 September low, was there a cluster at 7113, and was it worth a trade? Well, using David’s 256 point lesson and multiples of the 89 point First Range Out gives us 7035. Also, on a trading day chart, the 8×1 called the 27 September top exactly to the point, so the 1×1 trading day angle that crossed 29 September at 7130 was another reason. Also, 7113 was a higher bottom above 200% of the August first range out at 7111. See Chart 4.
Chart 4 – Potential 29 September low
We now know that this low was taken out by 4 points on 1 October which then presented double bottoms with 29 September. Had you taken this trade and not moved your stop up to entry plus commission, then this would have been loss number two.
If you had gone for third time lucky out of the 6 October low, then you would have been rewarded with a nice small risk of 37 points which means a 10:1 RRR would be a much more achievable target for the near future. That also means that had you taken the first two entries then you would be still looking at an 8:1 on this move if it reaches 7478.
With sound money management rules, patience, and a willingness to take the bigger picture trades, we are still able to bank good profits that more than make up for one or two small losses.
Happy trading
Gus Hingeley


