Form Reading Repetition
One of the more under-rated trading techniques is form reading. It is understandable that in the early days of trading we are not seasoned well enough to understand the subtle signs of the market, however as you progress and study a market like a cow knows its calf, you should adopt the market wisdom and experience to see the subtle signs within your market.
Gann wrote about form reading in his Stock Market Course, saying that;
“Eighty-five per cent of what any of us learn is from what we see. It has been well said, “One picture is worth a thousand words.” That is why FORM READING or the reading of various formations at different periods of time is so valuable. The future is but a repetition of the past. The same formation at tops or bottoms or intermediate points at different times indicates the trend of the market. Therefore, when you see the same picture or formation in the market the second and third time, you know what it means and can determine the trend.”
If we turn our attention to the EURUSD market back in 2016 (ProfitSource Code: FXEUUS), we can watch the market unfold through a series of synchronized patterns. Through a combination of price, time and form reading, this period of market provided a very sound road map. Gann said that the “future is but a repetition of the past”, and that we can use hindsight to forecast. He went on to mention that:
“You do not have to accept my word that the rules I give you will work in the future as they have in the past, but you owe it to yourself to prove by past records that these rules work; then you will have the faith to follow them and make money.”
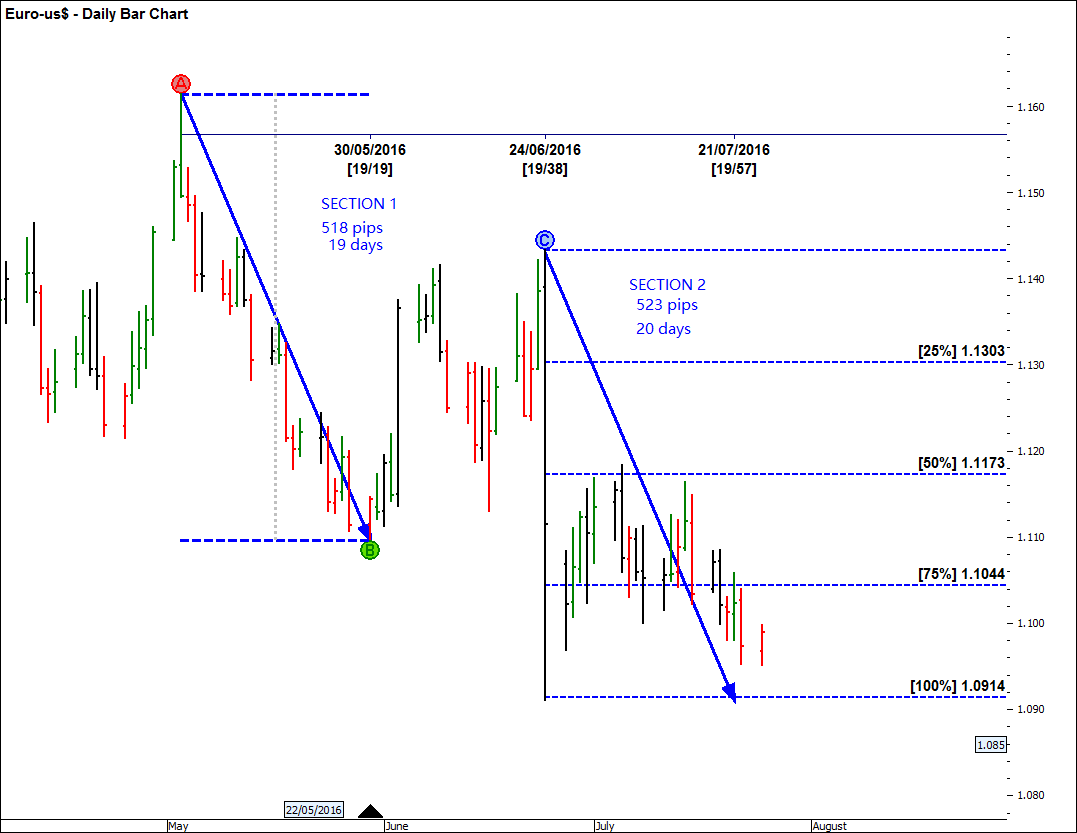
By taking these wise words and exploring EURUSD, the move started from the 3rd of May 2016 – being two days early of the May Seasonal Date for 2016 and ran into the 30th of May 2016 doing a run of 518 pips in 27 calendar days or 19 trading days.
What was interesting was that the market closed on the 23rd of June 2016 at 1.1385. One would assume that there was no way the market was going to get to 1.0914 in one day, especially when the market was pointing up. However, as history goes, the market did get to 1.0914 on the 24th of June 2016 to complete a 100% repeat of the first section down of 518 pips. The market moved 523 pips, all of which happened on the same day. Given that it had repeated a similar price cycle of 523 pips – time now had caught up.
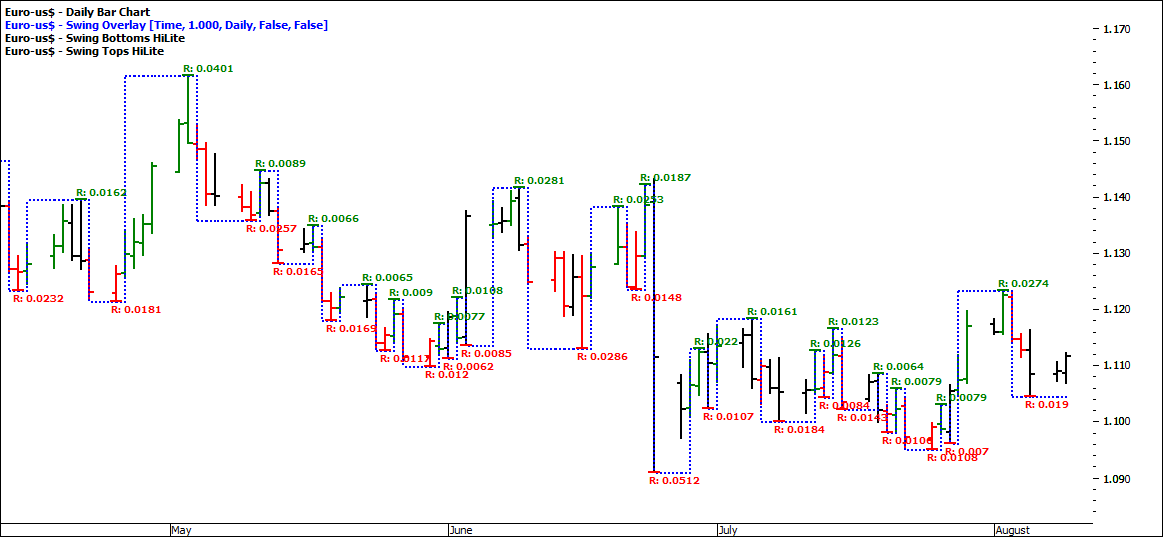
What is interesting from a form reading perspective was that when the market was trending down, it failed to have more than two consecutive days up. When the market finally did do two consecutive days up, the trend was obviously looking to change. Our time and price also lined up with these signs.
Our swing charts are highly helpful here. Regardless of the aggressive outside days, the swing chart guides the strength and weakness within the market, hence the reason David gets us to study the expanding and contracting ranges early on in our trading journey.
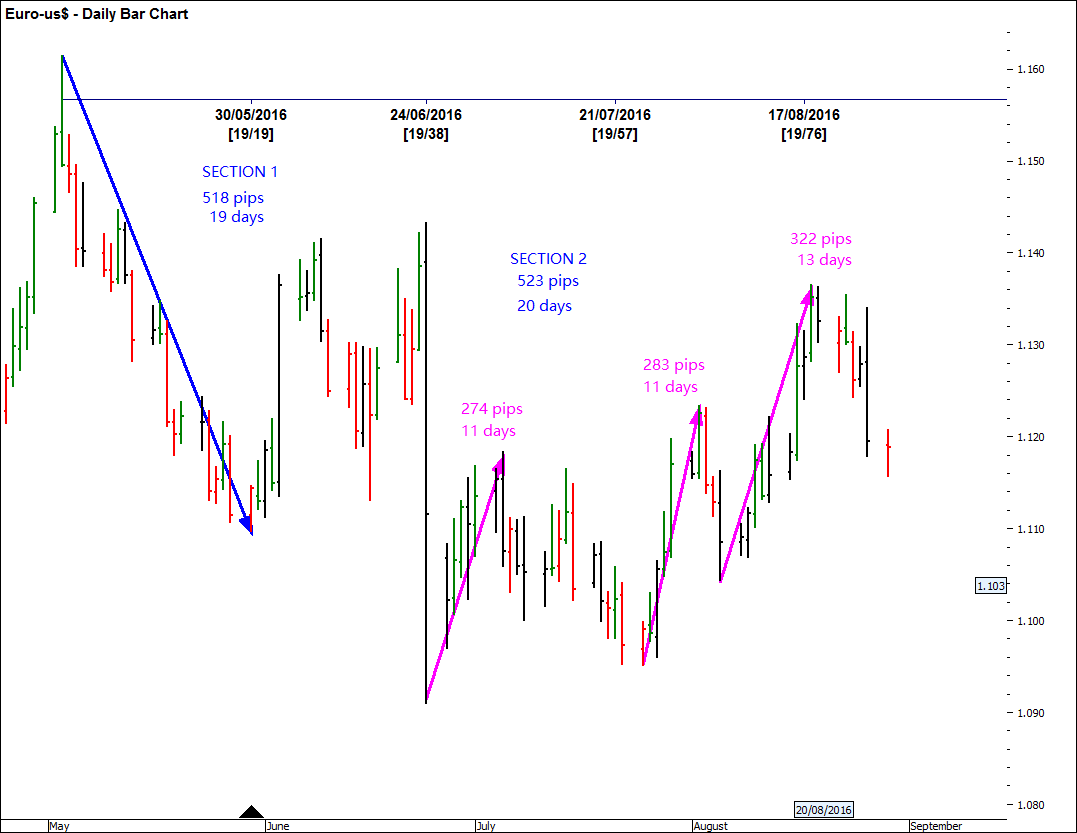
Moving into the next section, interestingly enough the pullback or reaction produced three bursts as opposed to Section One which only produced two bursts. Simple patterns like this are worth noting for the future.
Breaking down the pullback, each section is similar in pitch where price is divided by time. The pitch is spoken about in more detail in the Ultimate Gann Course and makes a powerful form reading technique. Try the calculations for yourself. Note the top was produced on the 18th of August. This was 1 day out – again. These subtle signs start to pay off as history is repeating in multiple ways.
Applying these techniques to the trending EURUSD chart today we continually see history repeating itself. There is power in form reading as well as knowing your market like a cow knows its calf. It has proven to be a very powerful combination of techniques and wisdom to understand the ebb and flow of the markets.
It’s Your Perception
Robert Steer


