Oil as an Indicator
2021 has been a year punctuated with so many different themes we could likely argue we are inundated with too many events and concepts to process. The human brain is a wonderful design but it is not a computer built to independently process tasks and if you need to throw more data to compute at it, you can just upgrade the hardware.
As the world economy goes, oil has been analysed and measured for decades and is entwined into the discussion of economic success as regularly as interest rates, as they are both an integral part of society. We as a global community are so reliant on energy for our needs and oil remains at the head of the queue, even with the explosion of electric vehicles we are not yet seeing the oil producers closing down wells and walking off storage facilities. Last month I mentioned the inflation question as one to ponder and its now I return to look at oil which I have largely not written about in 2021 which may seem strange as its has been my prime focus for the best part of 20 years.
The best way to describe my experience with oil is to stress the value of single market specialisation, as David would say “getting to know a market like a cow knows its calf”. Things I discovered over a decade ago are still working today which of course is something market analysts suggest is unlikely, especially in the field of technical analysis.
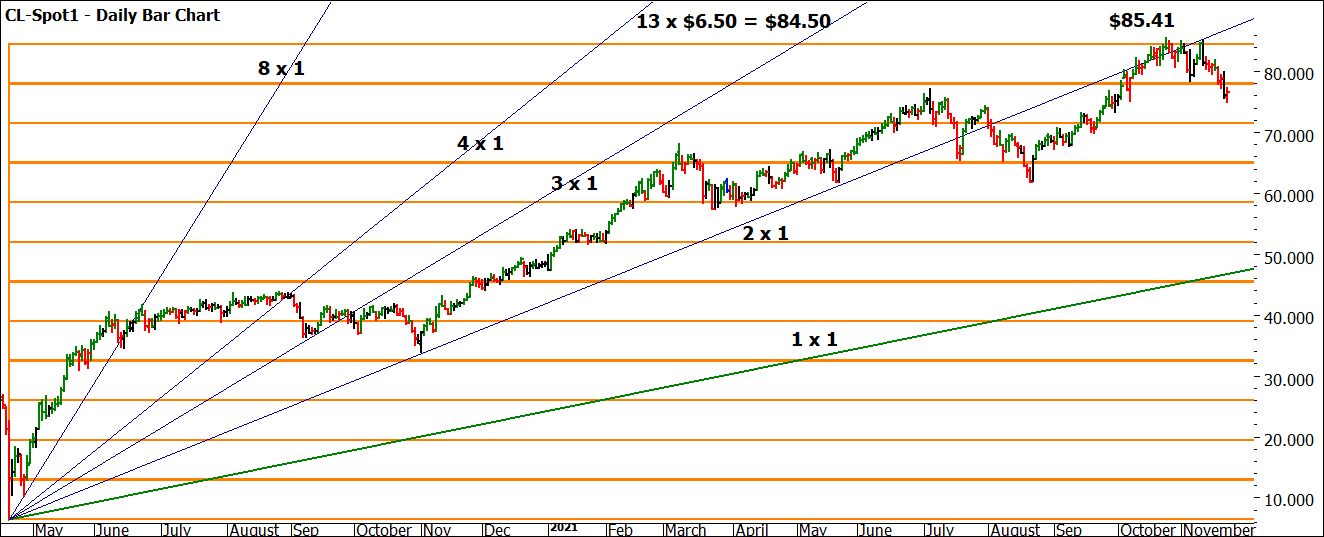
Chart 1 shows the position of Crude Oil, it has climbed from its sub-zero lows in 2020 back to the mid $80 price point in 18 months. Most in Australia will have noticed the greatest impact of this rise at the petrol pump. Using the low of $6.50 as a Lows Resistance Card we see how the current high of $85.41 on the 25th of October 2021. I have also added trading day angles to show how strong the trend has been.
Chart 1 – Daily Bar Chart CL-Spot1
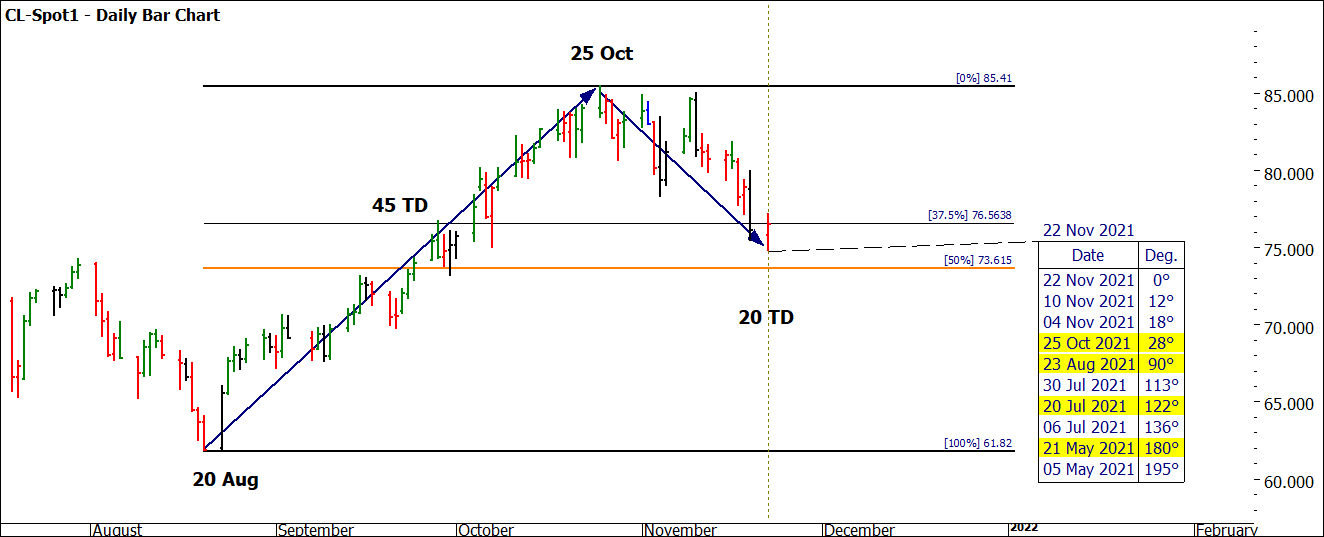
Chart 2 shows the smaller picture and takes into consideration what has been a recent sell-off. It’s important to consider are we seeing a decline in prices and the potential for a new A to B range being developed for future legs lower, or are we seeing the current pullback as a B to C range before we head higher again? This is where forming a bigger view with our sections and forecasting tools can be of help. If we apply some fundamental factors, we are seeing inflation readings from across the globe report what was expected – increasing inflation. The question now is, is it transitory or part of a bigger reset into the future?
If we measure the position of the market currently, we see expanding swing ranges to the upside and a retracement of less than 50%. I have also used trading days as the guide of time up and down. Finally, we see using 22 November as a zero date and running Time by Degrees backwards using the Quick Count Tool, there is some harmony to suggest the middle of the month dates have been helpful for turning points.
Chart 2 – Daily Bar Chart CL-Spot1
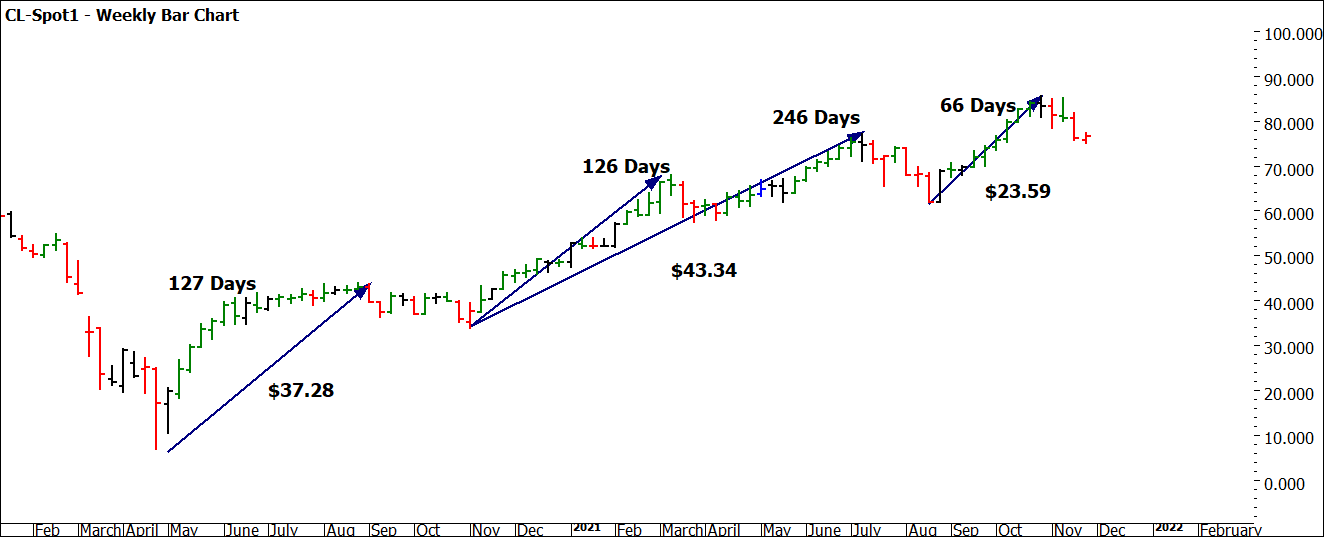
Chart 3 steps out to look at the bullish move from the lows in 2020. We can debate the sections that have been completed and whether there are two sections in the middle. This will not likely change the view that we are in a third section. Your job here is to take the ranges in price and time and measure their relationship to the broader oil market and the three sections.
Chart 3 – Weekly Bar Chart CL-Spot1
There are so many other techniques that we can add to the analysis picture, but I recommend you start simple and build up. At this stage, if you are new to oil there is little point attempting to forecast the market out to the end of next year and beyond. That being said, I already have my Road Map for 2022 and do expect good trading ranges to be in play.
Like nearly all commodities, they are based in USD so it can also be very helpful to study the signals that appear on the US Dollar index. The “usual” picture is a rising dollar puts pressure on commodities, but the recent patterns show we have broadly higher US Dollar prices and an increasing commodity price.
As students of history, you should feel comfortable to go back and research where and how this sympathy of pricing occurs, why and for how long? This research can add value to the charts to better understand the interdependency.
Good Trading
Aaron Lynch


