A New Year, A New You!
Welcome back everyone to a new year of the Safety in the Market Newsletter! Also, a warm welcome to all the new students who have just started on their trading journey. I’m sure you will enjoy the new discoveries as you work your way through the Active Trader Program and beyond!
2022 could be a great year for you if you choose. No doubt this year will provide many challenges which are out of our control however, the way we deal with challenges is totally within our control. The start of the new year could represent the start of a new you!
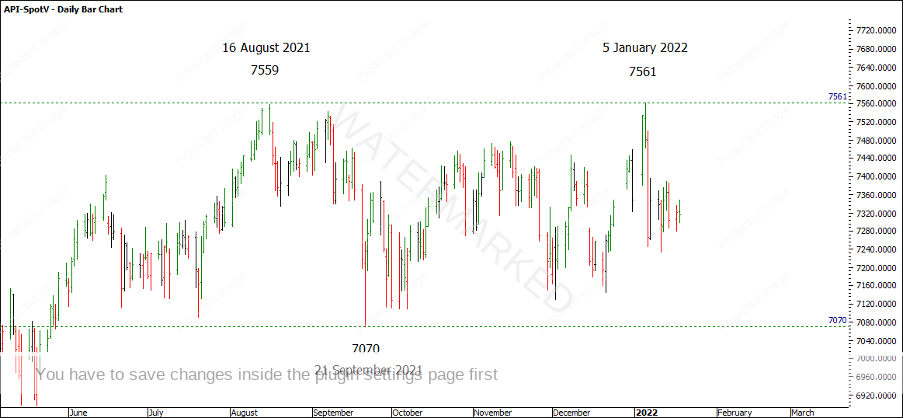
Last year I focused on just one market, the SPI. If you’re new to trading this year, the SPI is the Australian 200 index futures market, ProfitSource code API-SpotV. As you can see in Chart 1, the SPI has been mostly a sideways trending market within about a 500 point range for around 8 months, with short bursts to the upside and downside.
Chart 1 – SPI Daily Bar Chart
One of my key learnings from this period of the market can be summed up in a quote from David when he says, “When a market is trending strongly, it’s easy to make money, when it’s not trending strongly it’s hard to make money”. It’s worth considering the question “is it trending?” when taking a trade on your own markets this year.
One way of being on top of the good moves is patiently waiting for a good setup. The first ‘Setup’ we’re introduced to through the Active Trader Program is Double Tops and Double Bottoms. If you can identify a strong cluster using swing chart milestones then you’ve got a potential trading opportunity with a potential for a good Reward to Risk Ratio.
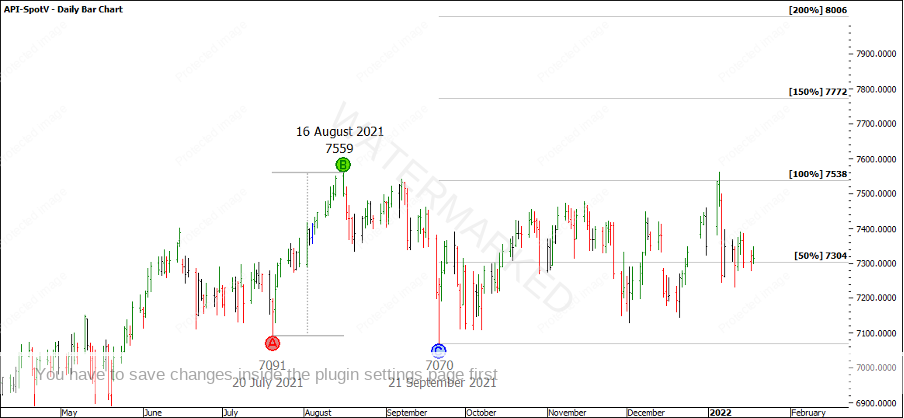
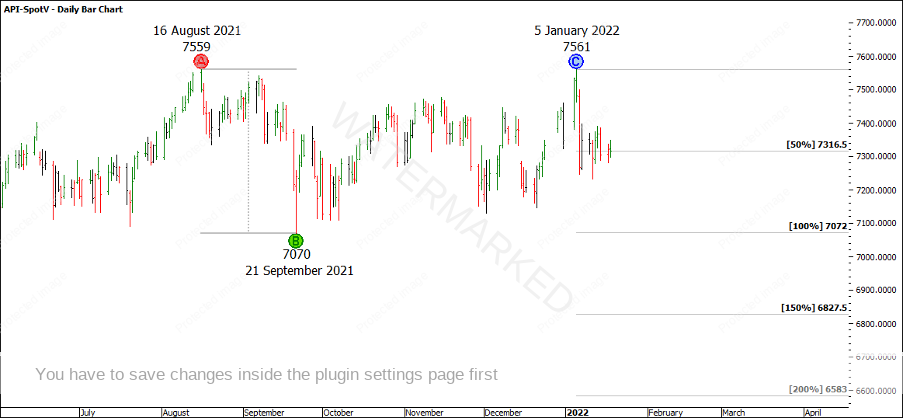
Looking at Chart 2 and Chart 3 below, I’ve highlighted the current double bottoms and double tops on the SPI and their respective major milestones!
Chart 2 – SPI Double Bottoms
Chart 3 – SPI Double Tops
These could be key milestones to watch this year and having both sets of milestones is a great way to help stay unbiased towards market direction. If the market goes up, these are milestone I watch and if the market goes down, these are the other milestones I watch.
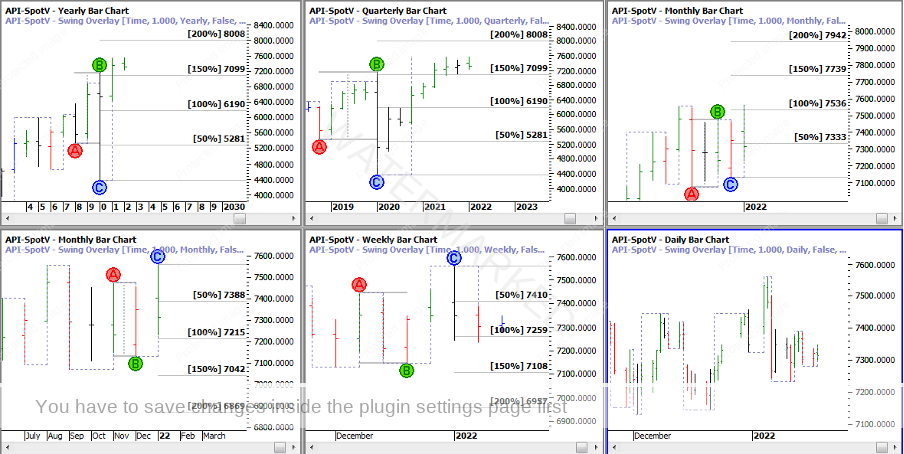
Next, you could look at the major swing chart milestones on ALL the times frames. Yearly, quarterly, monthly, weekly, 3 day, 2 day and 1 day. Can you see any Price Clusters? If yes, great and if not, that’s okay. It could mean you’re looking at a period of the market within a move and more market action needs to unfold.
Chart 4 – Swing Chart Milestones
I wouldn’t be surprised to see the SPI stay within this trading range for some time. On the other hand, you still need to be prepared for a break out either way and not be locked into one scenario. Keep an open mind and read what the market is trying to tell you.
There are also plenty of other markets out there to trade like currencies, commodities and of course stocks.
I wish you all the best for your study and trading in 2022!
Happy trading,
Gus Hingeley


