Dad, Do We Have Bitcoin?
Welcome to this month’s Platinum newsletter. There are literally too many things to write about this month as markets hit the next news capturing phase, with the Ukraine Russia “war” unfortunately crossing into military conflict from what had been political posturing and threats over the last number of weeks. I reflect on my own reactions to news, where 20 years ago “weather, wars and markets” causing massive volatility was an adrenalin inducing moment, as I thought how can I capture the opportunity? Now, a little older and hopefully wiser, it causes me to look at all sides of the issue, especially the human impact. As you know, crude oil has been a mainstay of my markets involvement for longer than I can remember. I could write thousands of words on what has transpired and what will be in the coming weeks, but I will push on with the article I had in mind at the start of week.
Though I would suggest that you go back and read the articles over the last 12 months, especially on oil, I have called for upside in crude and how commodities would be in play in 2021 /2022. These themes did not come about from this most recent crisis but have been laid out in cycles repeating over many decades. The big picture is your friend in these situations, and we are seeing a repeat of the 1999/2000/2001 pattern as previously discussed. Energy supply and security remain at the core of all developed economies, and I truly hope the world can find a solution.
My initial plan for this article has come about with recent discussions with my sons, especially my eldest who has been hit by the economics bug whilst studying in senior high school. I have enjoyed discussing the theory with him and he recently asked me the question, did we own crypto currency and could we invest in some NFT’s. Now I am never going to argue that I am across the breadth and depth of crypto and especially NFT’s (that took me some research to get a handle on) overall my observation is how mainstream this is in today’s youth (in terms of awareness). I would go so far to say in the near future the first investment someone may make will be in these new assets as opposed to a straight share purchase.
Now I don’t pass judgement on the validity or relevance of these assets, but they are here and growing and if we look at how Bitcoin has moved, I will assume most participants are from a younger demographic, and it would be a stretch to imagine they have all studied Gann’s work. So how is it that this market continues to follow the rules?
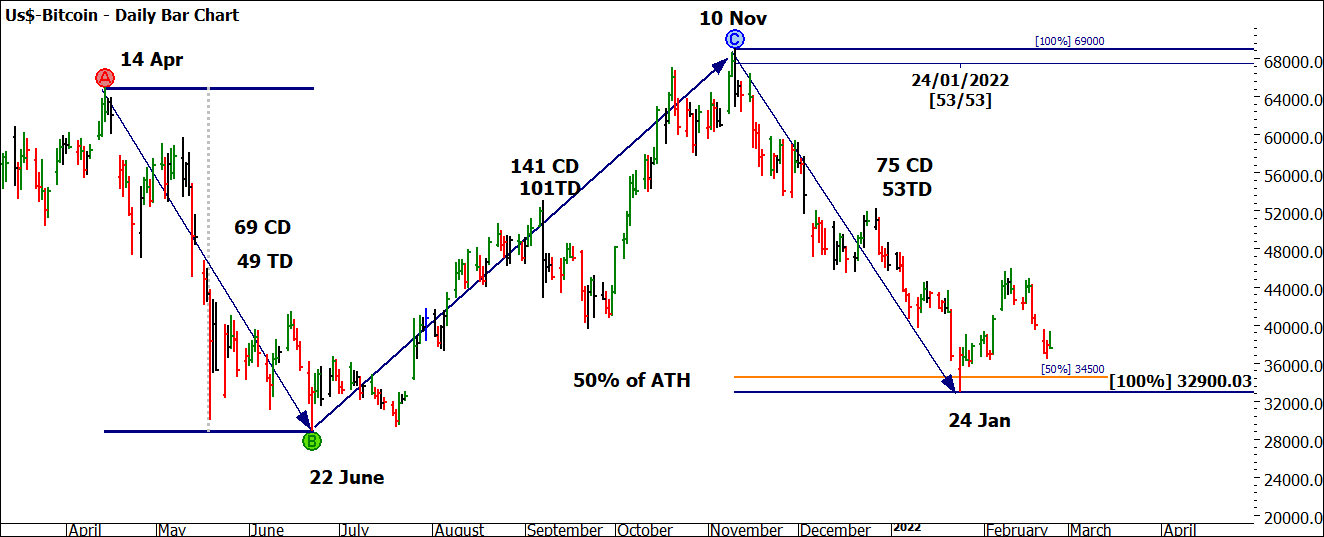
So, in answer to my son’s question, I explained to him we didn’t need to own the asset as such, but we could speculate on the price movement using leverage on an electronic platform, if we studied the price action. I think he may be hooked!! Chart 1 helps us understand the turning points that Mat’s recent video on the YouTube channel alludes to when we look to take large reward to risk ratios.
Chart 1 – Daily Bar Chart FXBCUS Bitcoin
Chart 1 lends to price and time work, but we can start simply.
The range in 2021 that ran to the downside into the 22 June (seasonal time) has repeated to 100% on 24 January this year. We have ranges repeating into major turning points, also a no brainer price tool is a Highs Resistance Card. 50% of the All-Time High is approximately $34,500 (orange line) and the price action did not close below that level. We could use this information to close short trades and initiate long trades.
We can also see approximate timings with the 2021time range of 69 days down, the most recent 75. Therefore, the price momentum down was slowing when compared to time. That is powerful in formulating a foundation of a trading plan. It’s also worth noting the time frames from June to November being approximately 200% of the downside ranges.
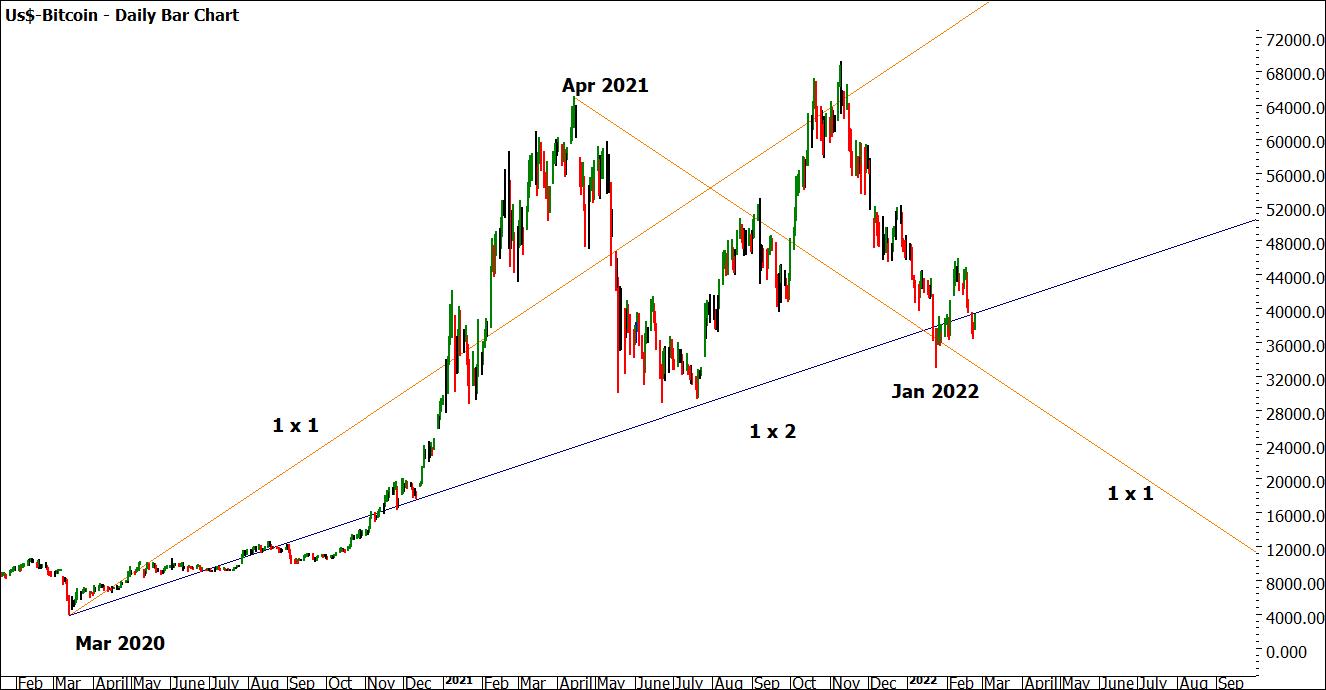
Chart 2 allows us to setup some basic angles to see how price and time align on the chart. Gann said markets, once they break an angle (confirmation is required) will move to the next angle.
Chart 2 – Daily Bar Chart FXBCUS Bitcoin
If we use angles to assist with the run down into the January 2022 low, once the 1 x 1 was broken we could expect the run down to the 1 x 2 (blue). We can also overlay the 1 x 1 of the April 2021 high and we see it hold the market up in January as well, making it a good place to close a short trade.
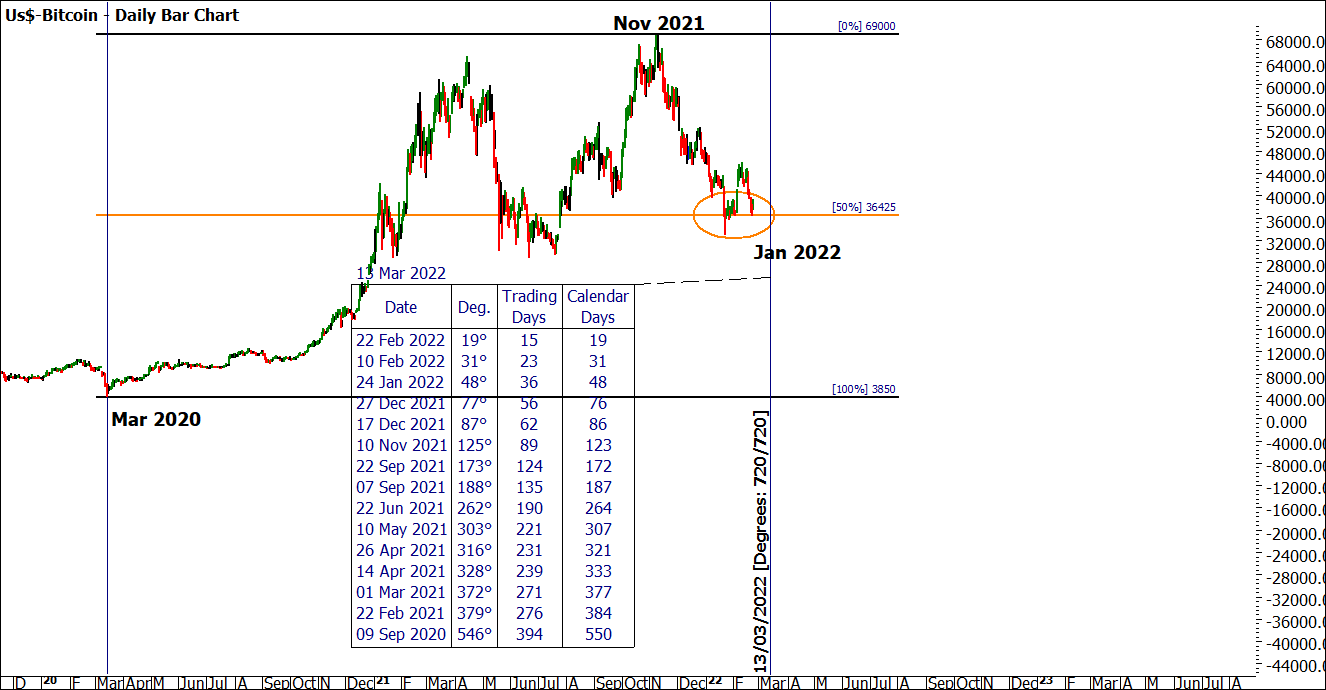
The final chart I’ll leave you with suggests some anniversary and price work to see the potential next move. Chart 3 shows the value of the Range’s Resistance Card (be sure to look at Lows Cards as well). The market is holding above the 50% level. What happens around here will be key.
Chart 3 – Daily Bar Chart FXBCUS Bitcoin
The low in March 2020 that started all this bitcoin attention was 13 March. I have anchored that as an anniversary date (I used to joke if you don’t think anniversaries are powerful, just forget one). It is a logical place to include in our analysis. Given portfolios are likely to be affected by volatility you could potentially use this asset class as a way to generate returns that are not stock market correlated. Who knows, it could become your market of choice, as I have been told by son, it’s what all the cool kids are doing these days.
Good Trading
Aaron Lynch


