So, how do we go about achieving a 10 to 1 RRR? Or, as in the case of the title of this article, how could we possibly set up a 50 to 1 RRR on a trade? First, let’s do some simple maths. Don’t worry, this isn’t like high school when the teacher says ‘simple maths’ but actually means complex trigonometry or calculus! When I say simple maths, I mean addition, subtraction, multiplication and division, and calculators are always allowed!
Let’s say you are trading shares in XYZ stock. Note: XYZ stock does not actually exist, I’m just using it as an example. Let’s say XYZ is trading at $10.00 per share, and you buy 1,000 shares at $10.00 each. You place a stop loss $1 away at $9.00, meaning you are risking $1 per share or $1,000 in total. To keep things simple in this exercise, we will leave brokerage and any interest payments out of the equation. Now, forget about the dollar amounts for a moment and just focus on the risk per share, which is $1.00. If you want a 3 to 1 RRR, you would need to sell your XYZ shares for a profit of $3.00 each, which means the price would need to go up to $13.00. If you want a 10 to 1 RRR, you would need to make $10.00 per share, meaning your shares would have to double in value to $20.00 each.
If you’re finding any of these calculations difficult, just write them down, one at a time. Now, in order to achieve a 10 to 1 RRR on a $1.00 risk, in this case, the share price had to double. How long does it take the share price to double? It can take a while! This may seem basic, but I’m building up to a point here. What is an easier way to achieve a 10 to 1 RRR, without needing the share price to double? That’s right – you would need to risk less than $1.00 per share in this example. Imagine that you could have entered the market with a risk of only $0.10 (ten cents) per share. A 10 to 1 RRR could be achieved with a rise in share price of $1.00, which is only a 10% move. That’s a bit more manageable than hoping the share price will double! So, what is the point of all of this?
The point is that if you want to increase your RRR, you have two options. You can either try to capture a higher number of cents or points per share, or you can cut your risk on the trade. Both strategies work. For example, in the Swing Trading Webinar, we spoke about using a daily swing chart to enter the market, and then using a weekly or larger swing chart to manage the trade, and extend the amount of Reward on the trade. In this article, however, we’re going to focus on cutting down the risk per share or risk per contract on a trade.
In the Ultimate Gann Course DVD on Time by Degrees, David talks about using a 4-minute chart to get in close around a major turn. Now, this wasn’t because he liked intra-day trading! No, it was because he was trying to increase the RRR on his trades. In a moment, I’ll step you through a real-life Case Study but think for a moment about the XYZ trade. What if you had identified a low in XYZ at a price of $9.92, for example. Imagine that your analysis showed Price Ranges, some Resistance Cards, equal Time Frames, multiple Gann Angles and the Square of 144 all leading into that low. You’re pretty confident that $9.92 is the low, so what could you do?
One option is to wait for the first ABC Trade, but to be honest, at this level, you should probably be thinking a little bit more aggressively than that. In Chapter 4 of the Ultimate Gann Course manual, David gives you four different methods for entering the market. Entry number two, called ‘upon confirmation of a swing’, would be a good place to start. With this kind of entry, you might be able to enter a trade with a risk as low as 10 or 20 cents. However, if you used a 4-minute chart, you might be able to get an entry with a tiny risk, perhaps less than 5 cents per share!
I want to make the point here that David did NOT use intra-day swing charts all the time. He states several times across the Ultimate Gann Course and the Master Forecasting Course that he used intra-day trading around a pressure point in the market to try and get a trade underway with a low risk, then he would back off and let the market run. You can see evidence of this in his 1986 trading in Chapter 9 of the Ultimate Gann Course. For most people, intra-day movements happen too quickly. You have to be extremely focused for a sustained period of time, and it tends to wear you down over several weeks. However, it can come in handy around a major turning point, as we will see. Now, enough of our theoretical example on XYZ – let’s take a look at an actual setup in the market!
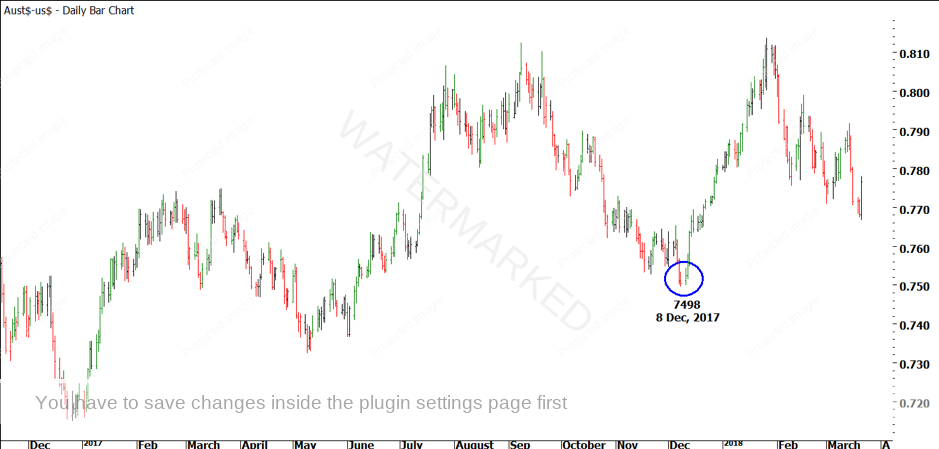
Around 24 hours before the Australian Dollar (FXADUS in ProfitSource) made a low of 7498 on 8 December, 2017, I sent out a bonus video to our Ultimate Gann Course Coaching students showing them compelling evidence to expect a low in the Aussie Dollar around 75 cents on December 8. Were you one of those students? Did you follow the setup?
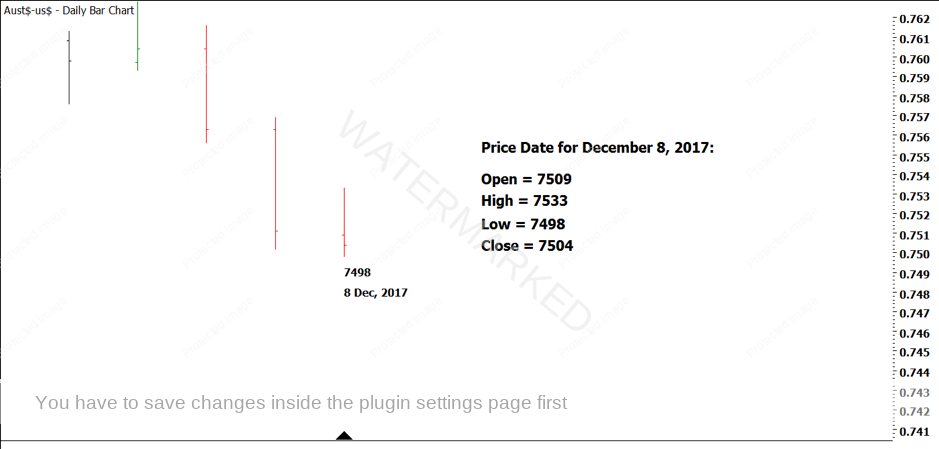
We have spoken about this low already, in the January, 2018 Edition of the Platinum Newsletter. If you spent some time studying the January article, you will know it was a pretty strong Classic Gann Setup, with lots of supporting evidence. Here is the low again, to refresh your memory!
Did you do the calculation, or are you hoping I’m going to do it for you? Well, you’re right, I am going to do it for you, but you should still attempt it yourself first. The high of the day was 7533. We want to enter IF and WHEN the swing chart turns up, so we would enter if there was an up day, making our entry one point above 7533, which is 7534. We would place a stop loss one point below the low of the day. If the swing chart turns up, the 8 December low becomes a swing low, which is a good place to put our stop loss. The low was 7498, so our stop loss would be at 7497.
Now, forget about position sizes for a moment – they are different for just about every trade. Let’s focus on the risk for this trade. An entry at 7534 minus an exit at 7497 means a risk of 37 points on the trade, which is actually a fairly good entry on the Australian Dollar, especially around a potential Classic Gann Setup!
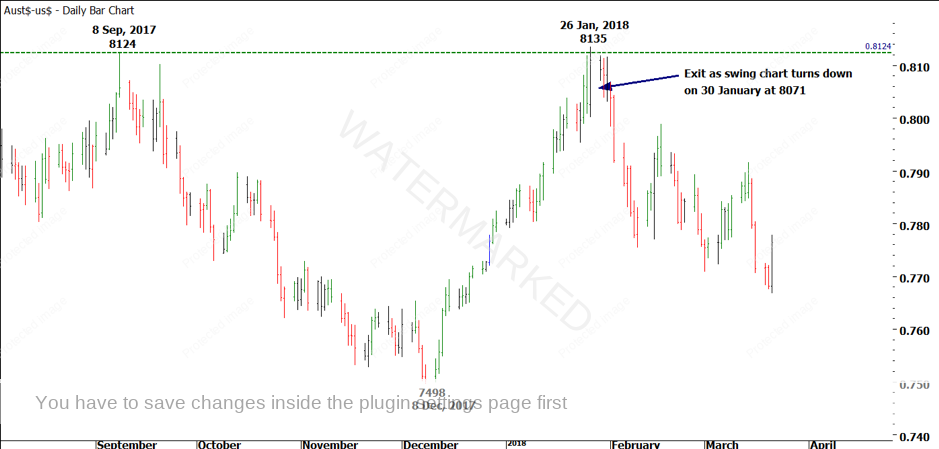
Let’s fast forward a little bit. Again, forget about trade management for this example. I just want to explore the Reward to Risk Ratio. Let’s assume that you managed to hold on to the trade until the 26 January, 2018 top, which ended up as a Double Top, with a False Break of the first top from 8 September, 2017. The False Break was confirmed on 30 January, 2018 and you might have exited at 8071 as the swing chart turned back down. This is shown in the chart below.
Using a daily bar chart entry, it was possible to achieve 537 points of profit in this trade. To achieve a RRR of 50 to 1, you would need to do one of two things. You would either need to:
- Pyramid your position by adding more contracts as the market rose; or
- Lower your initial risk by entering earlier.
While it is usually possible to add additional contracts to your position as the market moves in your favour, this wasn’t the easiest move to pyramid, because it was surprisingly sharp. So let’s look at ways of lowering our risk on the trade. If we assume 537 points of profit, then to achieve a 50 to 1 RRR, we would need to enter with only 10 points or so of risk (537/50 = 10.74). This means we would have to enter BEFORE the daily swing chart turns up. So, how might we be able to do this?
First, you might consider using an Opener’s or Closer’s Rule entry. These are discussed in the Number One Trading Plan. However, these kinds of entry tend to work better on stocks, which have a clearly delineated opening and closing time each day, whereas currencies are a 24-hour market, with no real close during the week. Another alternative you might consider is to use some intra-day charts to enter the market.
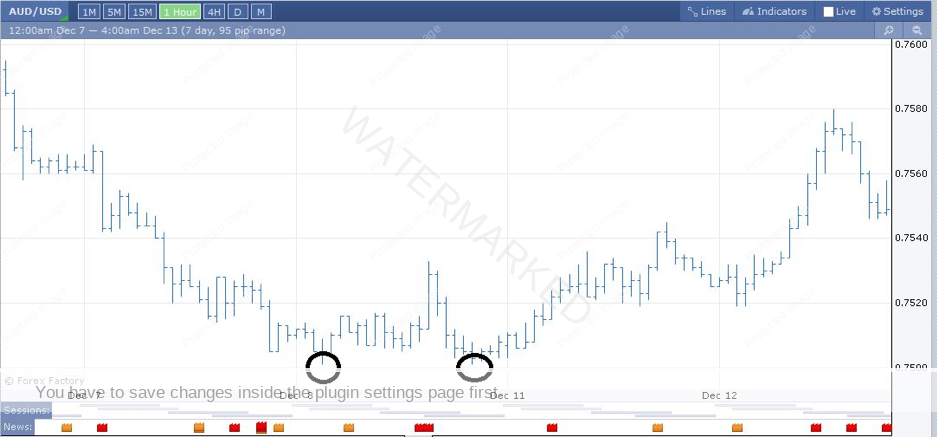
Now, I will repeat what I said earlier – intra-day trading is not for everyone, and not for all occasions, in my opinion! However, David said that he used it when he wanted to get really close to a turning point. This means that he had already worked out his pressure point in both Time and Price. Think about the Australian Dollar – we were looking for a price around 7500, and it was on the pressure date of 8 December, 2017. This is an occasion that we could consider applying intra-day analysis. Take a look at the hourly chart from that day.
Now, imagine this hourly bar chart was a daily bar chart. If you were expecting a major low, and a Double Bottom came in at your target price, on your target date, what would you do? How would you handle it? Could you enter as the swing chart turns up, perhaps? You could! In this case, you may not believe it, but an entry as the hourly swing chart turned up (after confirmation of Double Bottoms at the price target!) could have been taken for as little as 7 points of risk! 7 points!
Imagine for a moment that you had followed David’s suggestion and entered the market on an intra-day chart, for a risk of 7 points. Actually, let’s say you were a little bit conservative, and you allowed a few extra points for your stop loss, so your risk became 10 points instead of 7. After entering the trade, you then sat back and did nothing, just leaving your stop loss where it was and letting the market run. Then, you closed the trade for a 537 point profit, as we saw earlier (actually, the profit would be more than 537 points because we entered earlier, but let’s not be greedy!). 537 points divided by a 10 point risk equals a 53 to 1 RRR. And that’s only using an hourly swing chart! Had you attempted to enter on a 4-minute swing chart, you could quite possibly have lowered your risk even further.
Be honest with yourself – when you first read the title of this article, and saw ’50 to 1’, what did you think? Did you think it was possible? Do you think it is possible now? I’m not saying that every trade can be a 50 to 1 winner. David said that he saw three to four really good trades on a market every year. In this case, a ‘really good trade’ would be a Classic Gann Setup.
Now, even though this article has gone on for a lot longer than I had intended, I still want to talk about position sizing, very briefly! If you took a $250,000 long position on the Australian Dollar, you would have to put up a margin of around $A1,250 to $A2,500 to be in the trade. Each point of profit would be worth $US25. So, for a risk of around $US250 ($US25 x 10 points of risk), a 500 point profit would have made you $US12,500 (500 x $US25). Not bad for a single trade – and that’s without any compounding along the way. Not to mention, within a week or so, or perhaps even a few days, you could have moved your stop loss to entry plus commission, or even entry plus a little bit of profit.
I hope this article has encouraged you to ‘think big’ with your trading. David says that we put a lot of time and effort into learning how to trade, so we should make sure we take full advantage when a profitable trade comes our way. Next time you find a tight Time and Price pressure point in the market, how will you trade it?
Be Prepared!
Mat Barnes


