eBay Trading
Welcome to the March edition of the Safety in the Market Monthly Newsletter. This month I want to take a look at a case study on a US stock that trades on the NASDAQ, code: EBAY. I would just like to emphasise, during this time of increased volatility in Europe, trading stocks comes with increased risk of being gapped against and therefore this is not a recommendation to trade this stock. It is however a good case study worth looking at further.
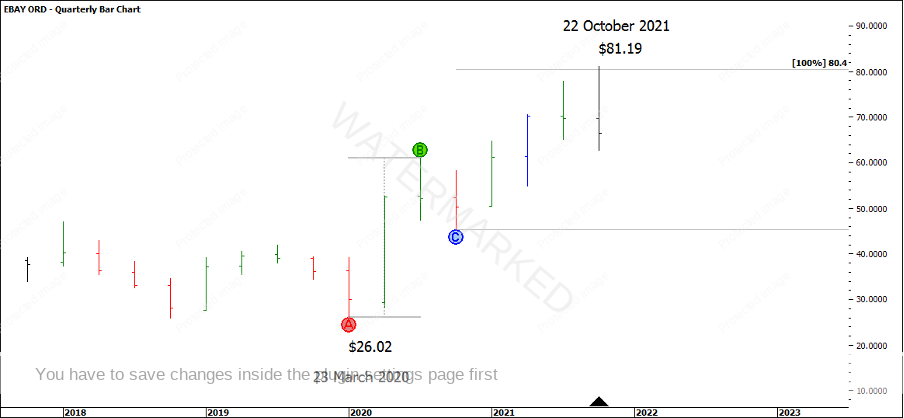
Using the techniques in the Active Trader Program Online Training (ATPOT) we can see strong evidence to suggest that the 22 October 2021 high at $81.19 has potential to be a strong cluster. We can see that the market has certainly fallen away from this price level but can you use hindsight to call this turn to be able to use foresight the next time?
Chart 1 below shows 100% of the quarterly major milestone forming one part of the cluster.
Chart 1 – Quarterly Bar Chart
If you want to analyse the setup further, go ahead and see what else you can find to add to this quarterly swing top cluster.
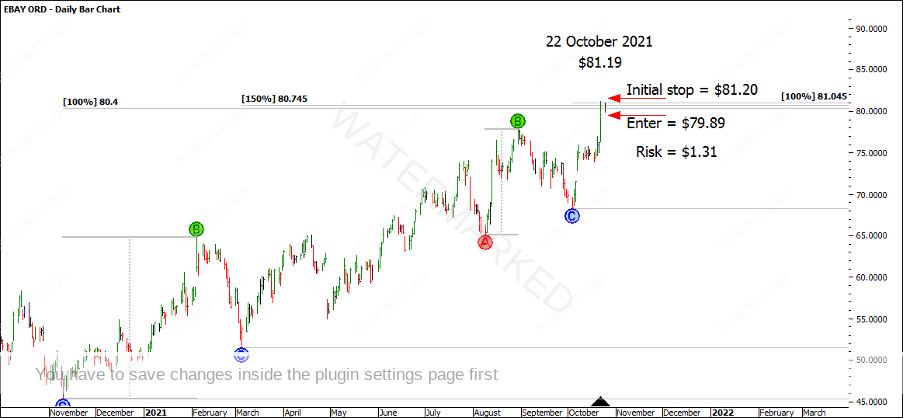
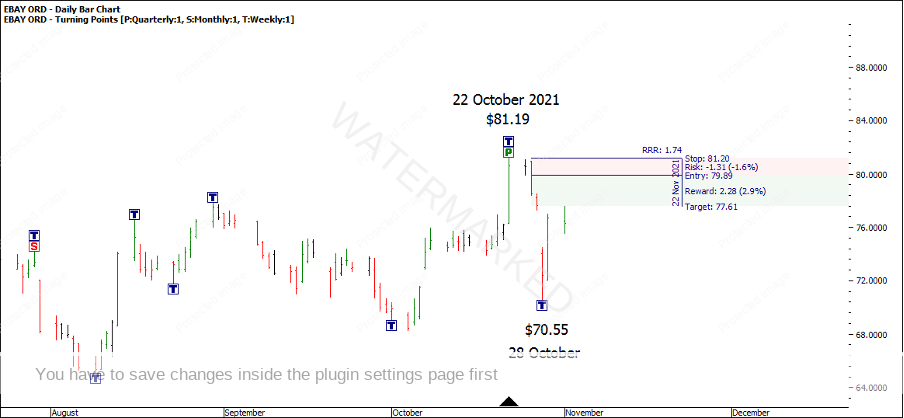
Next is to define an entry strategy, a stop management strategy and an exit strategy. The day after 22 October was a small inside day, meaning if the next day broke the low of the inside day, you could enter short as the swing chart turned down at $79.89 with an initial stop loss one point above the high of 22 October at $81.20. This would give you a risk of $1.31 on this trade.
If you had a $5,000 account risking 2.5% or $125, you could short sell 95 CFD’s ($125/$1.31). With a margin requirement of 20%, you would be looking at about $1,518 in margin for this position.
Chart 2 – Entry Parameters
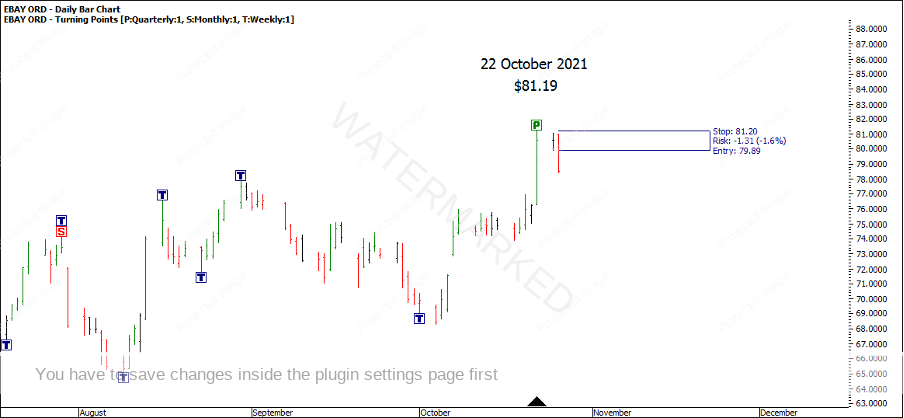
The following day on 26 October, the market was a confirmed down day triggering your entry short at $79.89, with a stop loss one point above the high of 22 October at $81.20.
Chart 3 – Short Entry
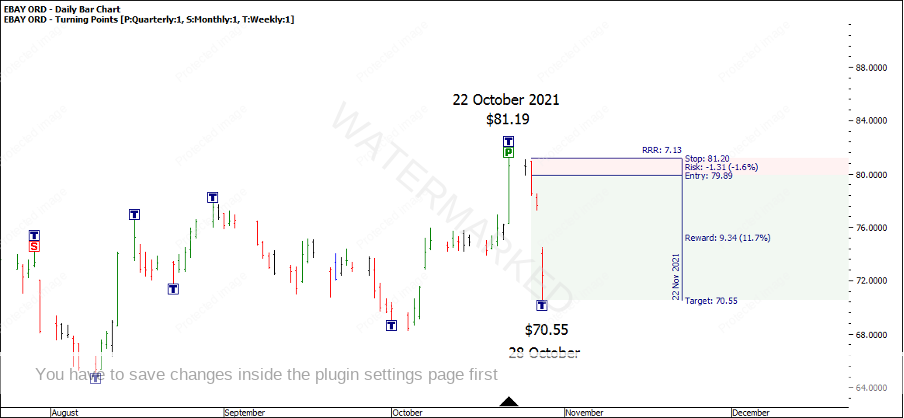
Two days later on 28 October, the market gapped down on open and reached a low at $70.55. At that stage you would be up 7:1 on your trade. If we take the advice to never let a profit turn into a loss, we could at least move our stops to break even to cover all the risk in this trade.
Chart 4 – Short Entry
If you walk through another two trading days later on 1 November, your 7:1 has now reduced to a little more than a 1.5:1 reward to risk ratio trade. This is something that can be hard to sit through and can play on your emotions and is good to be aware of. It is worth considering if you’re the kind of person who can handle this situation, or are you the kind of person who would want to lock in profit then look to re enter the market at a later stage?
Chart 5 – Short Entry
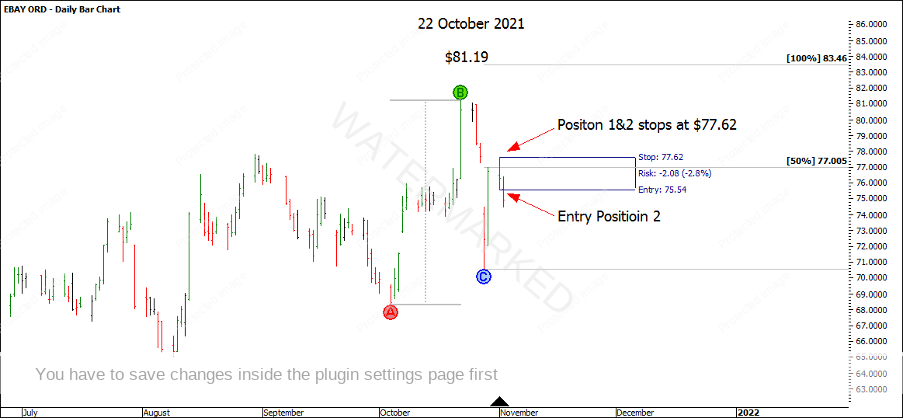
In this case, 1 November was a signal bar and presents another potential entry by way of a first lower swing top trade, with a risk of $2.08 per CFD. What’s important here is, if the following day is a down day we could be triggered into a second position and then move the stop loss for position one down to $77.62. This then locks in $2.27 per CFD of profit for Position 1 and therefore both positions are essentially at break even.
Chart 6 – First Lower Swing Top Trade
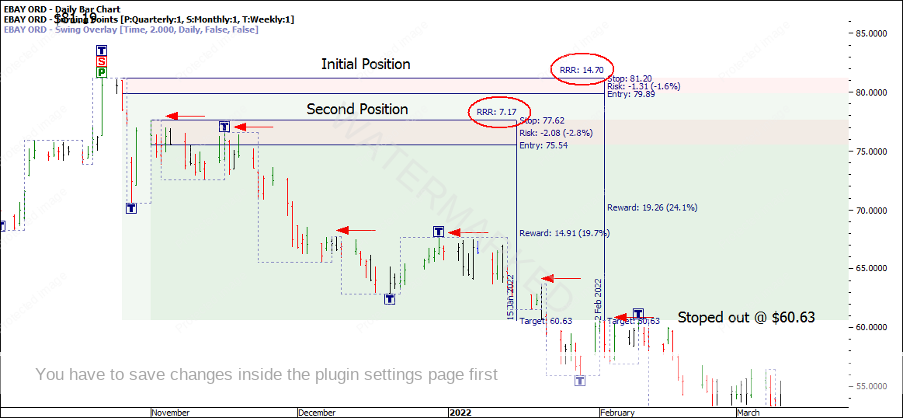
For the rest of the move, I’m going to use a 2-day trailing stop strategy. As you can see on 9 February 2022, after a series of 2-day lower swing tops, both positions would have stopped out at $60.63 giving a RRR of 14.7:1 on Position 1, and a 7:1 on Position 2.
Chart 7 – Trailing Stop Management Strategy
Looking at our totals, these two trades combined netted just short of a 22:1 Reward to Risk Ratio in about 3.5 months.
In reality there are many different ways to enter and manage stops to help take high reward to risk ratio trades. If you would like some extra content to study to help increase your RRR, check out the brand-new video on the Safety in the Market YouTube channel, ‘How to Increase the Reward to Risk Ratio on your trades’.
Happy trading,
Gus Hingeley
