Supercharge Your Reward to Risk Ratio!
Welcome to the March edition of the Platinum Newsletter. I always look forward to the March seasonal date as there are often very good trading opportunities around this time and it’s also a change into one of my favourite times of year, Autumn.
In terms of seasons of a trade, Spring is our best time to enter to achieve high Reward to Risk Ratio returns. Often, it’s not hard to get set into a large Reward to Risk Ratio trade, rather it’s navigating false entries and combatting emotions to hang tight for these double digit returns that can prove the toughest.
This month’s case study is on the recent 5 January double top on the SPI200 and how one entry could have seen you bank either a 7:1, 20:1, 30:1 or 45:1 Reward to Risk Ratio depending on your entry time frame.
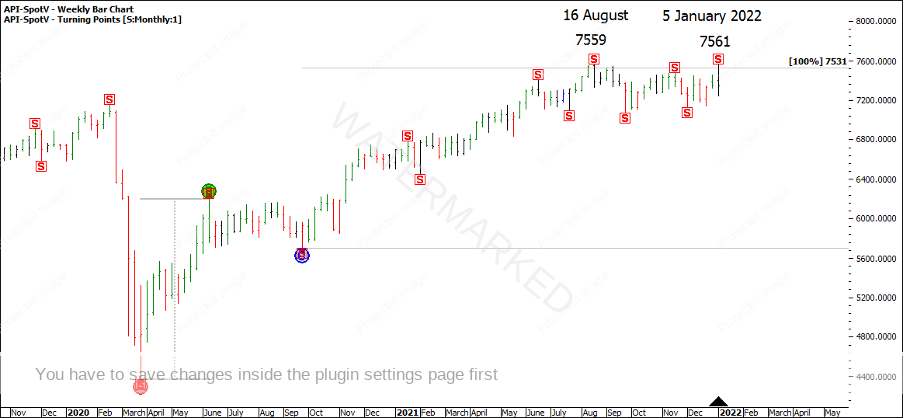
Firstly, a look at the basis of the setup. After a very lacklustre Christmas rally, the 5 January false break double top came in on the 100% milestone of the monthly First Range Out from the March 2020 COVID low. See Chart 1.
Chart 1 – Monthly First Range Out
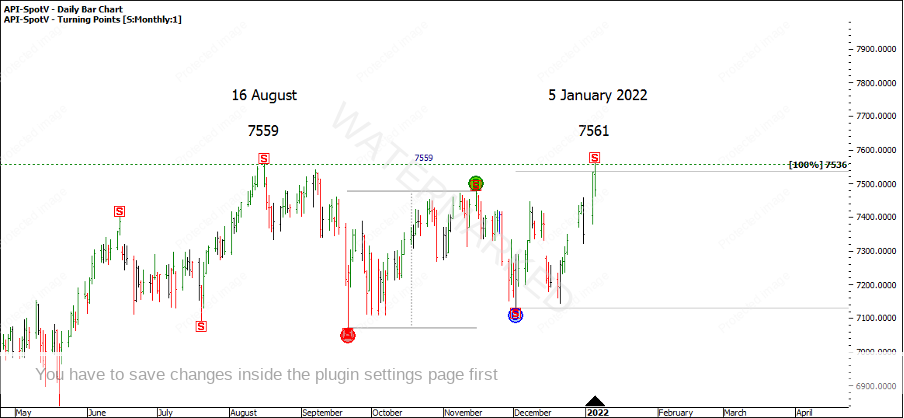
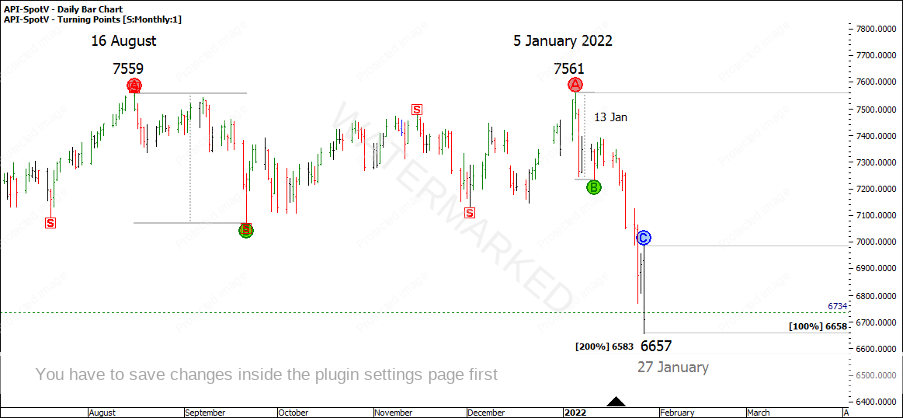
There was also a second repeating monthly range into the double top, with a false break of the 16 August 7559 top by 2 points. This last monthly range up was also contracting in time.
Chart 2 – False Break Double Tops
This setup wasn’t quite perfect, as the last weekly swing was an expanding range, just casting a little bit of doubt about whether this top would hold or whether we would see a third weekly section up. However, there was a contracting daily range into the top and it’s at these times that you need to make a decision, is it worth taking a trade?
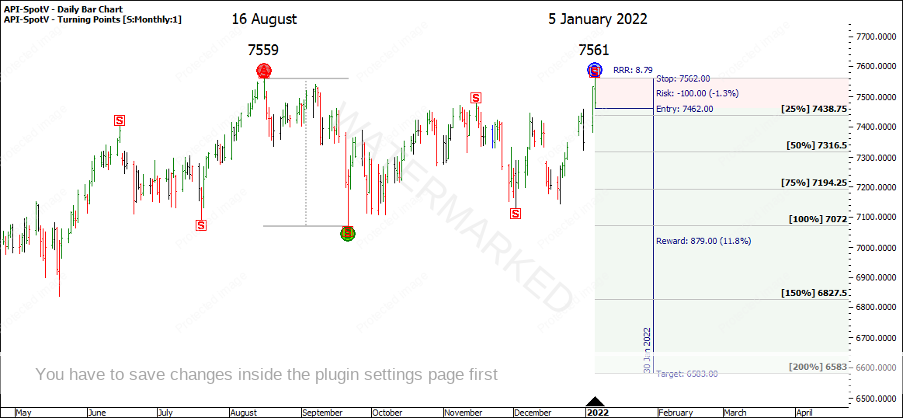
Looking at end of day data, 5 January was a clear signal bar after the false break. If we take the safest option of an end of day entry as the swing chart turns down, we would have 100 points of risk. If we assume a 200% double top target of 6583, this gives us a potential for an 8.79:1 Reward to Risk Ratio trade.
Chart 3 – Daily Entry Reward to Risk Ratio
A near 9:1 would be a good result, but we can increase this potential to double digits by using the exact same entry strategy, just dropping down a few time frames. For this case study I’ll use four different time frames, the daily, 4 hour, 1 hour and 15 minute bar chart as our method of entry and compare the returns at the end.
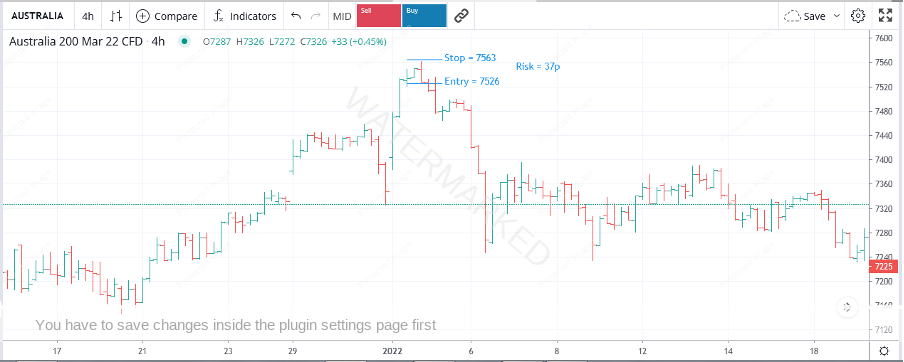
In Chart 2 below, the 4 hour bar chart shows a great signal bar after the false break with a risk of 37 points. (Just be aware the below trading platform shows the high of the day as 7562, so exit stops will be quoted at 7563). With an entry at 7526 and a 200% target of 6583, this gives 943 points of potential profit and an increased Reward to Risk Ratio of 25.5:1!
A key point to mention is the main part of the cluster was 7531-7536. Note on the 4 hour chart there was no ‘false entry’ previous that would have produced a loss. The cluster was hit, followed by a false break of the previous top by 2 points, then a signal bar with an entry point just under the cluster.
Chart 4 – 4 Hour Bar Chart Entry
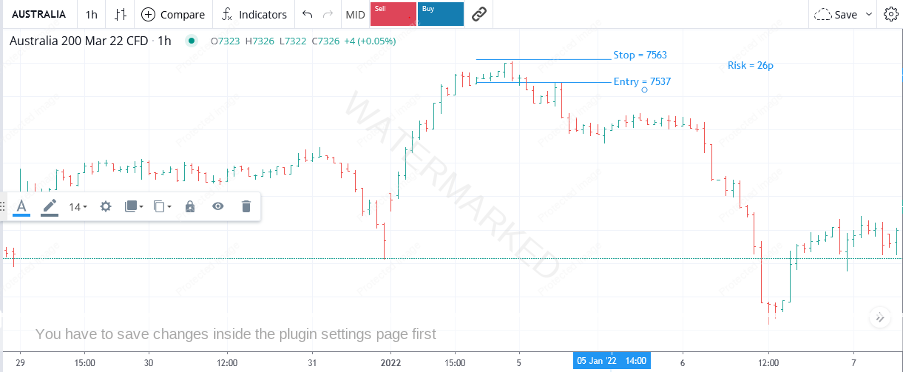
The 1 hour bar chart also showed a strong signal bar with a risk of 26 points. With an entry at 7537 and a profit target of 6583 that gives us 954 points of potential profit and a Reward to Risk Ratio of 36.7:1! Note here there was the potential for one false entry with an outside continuation hour that may have resulted in a loss.
Chart 5 – 1 Hour Bar Chart Entry
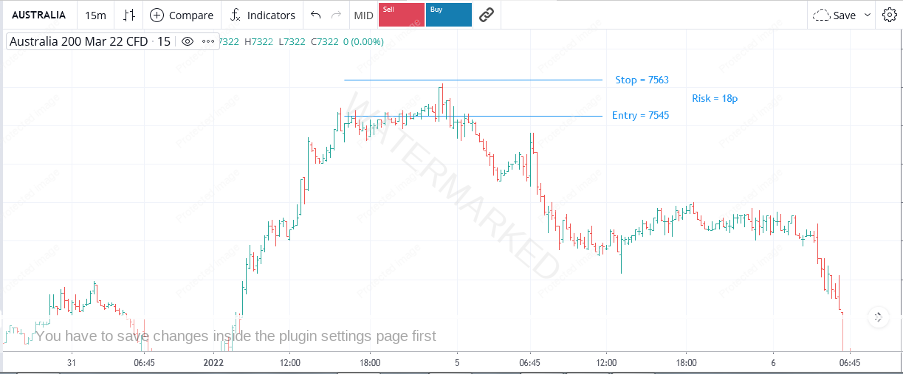
The 15 minute bar chart also showed a signal bar with an even smaller risk of 18 points. With an entry at 7545 and a profit target of 6583, that gives us 962 points of potential profit and a Reward to Risk Ratio of 53.4:1! This is where a 15 minute chart can get tricky and may produce more false entries, as you can see many small swings leading into the final top. If you were waiting for the false break then no losses would have occurred, but if you were trading the exact cluster then the potential for increased losses is there.
Chart 6 – 15 Minute Bar Chart Entry
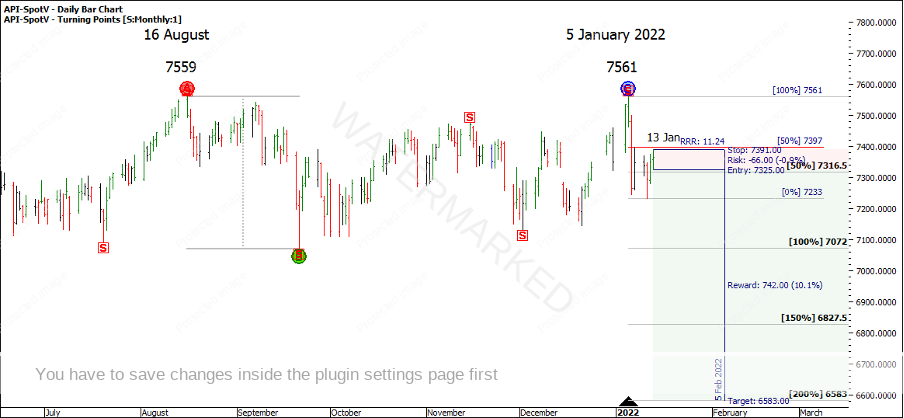
Fast forward to 13 January, and for the end of day trader you may be anticipating a second entry by way of a first lower swing top trade. 13 January wasn’t a signal bar but was still in a weak position as it hadn’t broken the 50% retracement, and you could have your orders set in anticipation of a confirmed lower swing top.
With an entry stop at 7325 and an exit stop for 7391 this would give a much lower daily risk of 65 points compared to Position 1 of 100 points. Anticipating the double top would reach the 200% milestone of 6583, this trade holds a potential 11.24:1 Reward to Risk Ratio or combined 20:1 for both positions.
However, if you are triggered into this second trade you could move your stop of Position 1 to 7391, locking in 71 points of profit, meaning both trades combined are at slightly better than break even with 6 points of profit if the trade is then stopped out. This means you don’t let a profit turn into a loss, but this is a riskier trade as you run the risk of being stopped out of both positions early.
Chart 7 – Daily First Lower Swing Top Entry
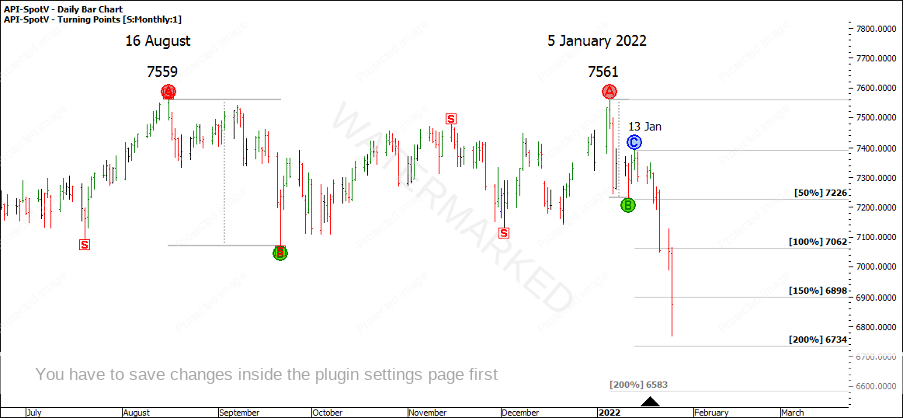
Skip ahead nearly two weeks to 25 January and the move down has been strong. Applying our ABC Pressure Point Tool to the daily First Range Out, we are fast approaching the 200% major milestone of 6734. This doesn’t cluster with the 200% double top milestone, but from experience, 200% of the First Range Out can be a great place to lock in profits, as I have previously hung in for a bigger milestone to be hit only to see so much profit disappear. So, for this case study we’ll adjust our profit target to 6734 as this is only 151 points short of the original 6583 target.
Chart 8 – Daily First Range Out Target
On 27 January 6734 was hit and our positions are exited. The market ran a bit lower to 6658 which was within one point of an exact 100% repeat of the daily First Range Out. This was a sign that the move could be over and exiting at 6734 had you achieve what was David’s main objective of taking 50% of the major move.
Chart 9 – 3 Sections Down
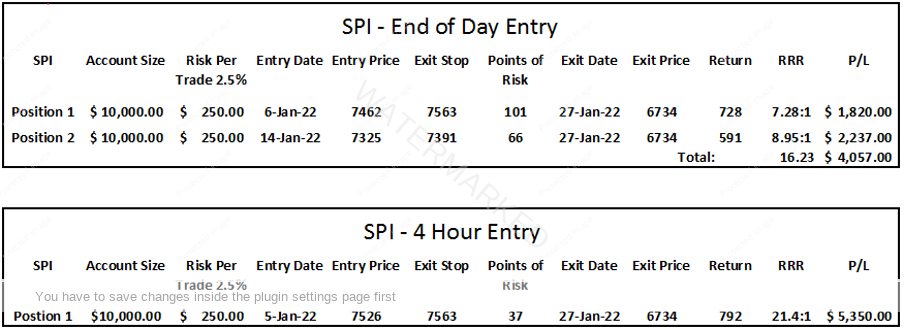
So how did using the same entry strategy as the swing chart turned down across four different time frames go? Well, our end of day entry combined with a second position still had a good double digit return of about 16:1 in 21 days. This is still a good result!
However, as you can see, dropping down each time frame greatly reduced the risk on entry while massively increasing the Reward to Risk Ratio, see below.
Taking a handful of these trades per year will do wonders for your trading account! The team at Safety in the Market have been working hard to bring you more content to help you achieve high Reward to Risk Ratio trades, so head to the Safety in the Market YouTube channel and check out the latest videos and don’t forget to click on the like button to give them the thumbs up!
Happy trading
Gus Hingeley
