Big Profit Exit Strategy
Welcome to the April edition of the Safety in the Market Monthly Newsletter! This month I have a great case study on the 15 April 2010 top on the SPI200 and the move that followed it. Don’t be too quick to discard the relevance of a setup from 12 years ago! Looking over past moves on a market is a great way of preparing yourself for the moves yet to happen. David used to say, “your hindsight will become your foresight if you use it often enough”. The key word there is IF you use it.
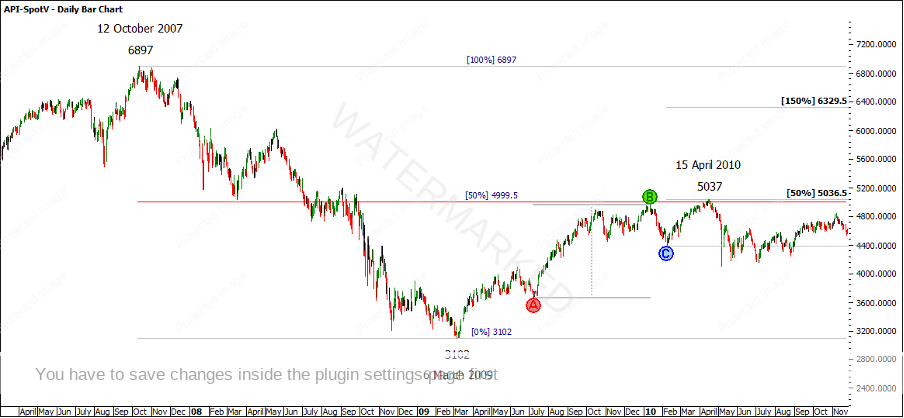
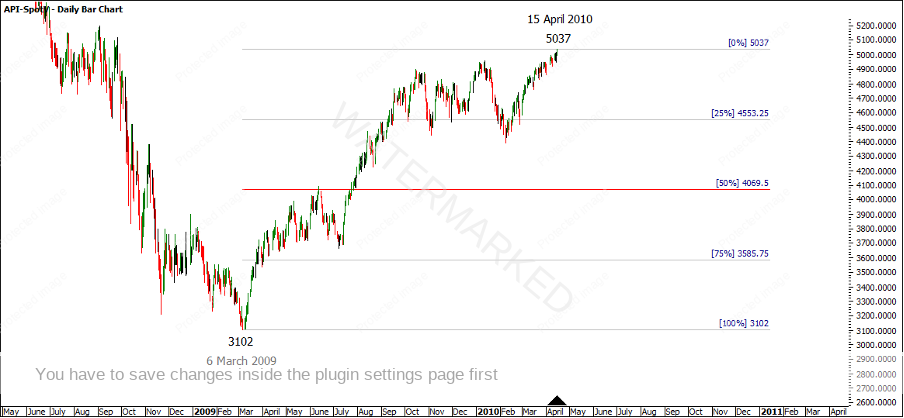
An overview of this cluster shows that major milestones have the ability to call major turns. In Chart 1 below, I’ve highlighted 2 major milestones that form part of this cluster.
Chart 1 – SPI200 Major Milestones
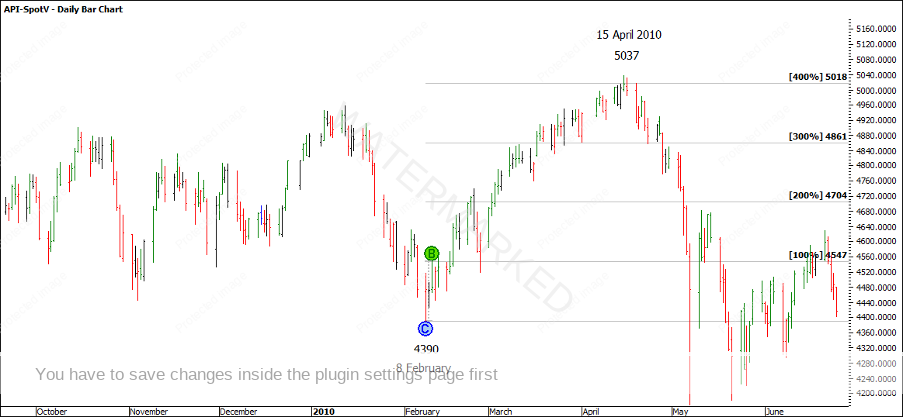
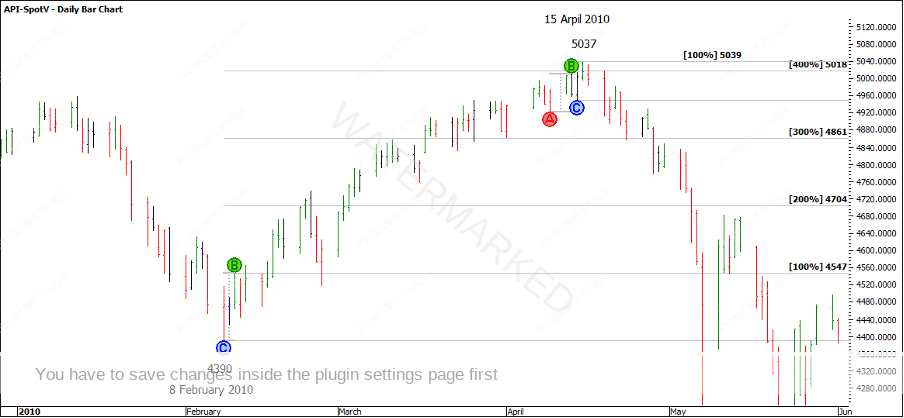
A 50% retracement of the quarterly range, combined with a second section 50% milestone forms the basis of this setup. To add another juicy piece to this cluster, apply David’s 256 point First Range Out lesson (from The Number One Trading Plan) to the daily First Range Out from 8 February 2010 low. See Chart 2.
Chart 2 – Multiples of the First Range Out
The three numbers that make up this cluster are:
- 50% quarterly swing retracement = 4999.5
- 50% of Section 2 = 5036.5
- 400% of the daily FRO = 5018
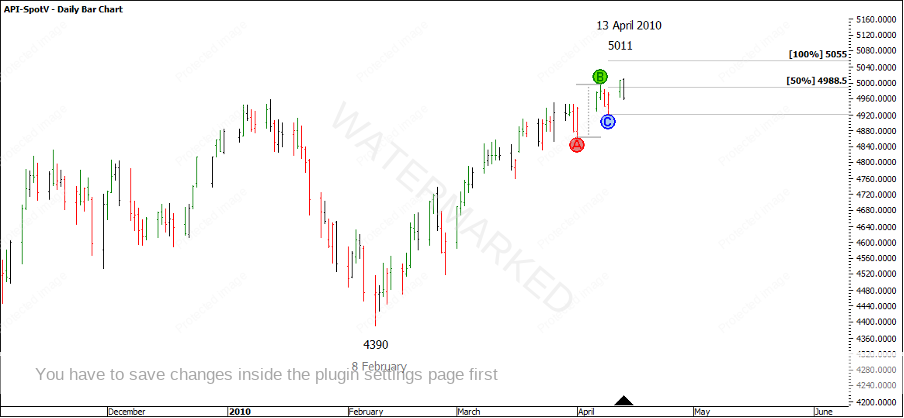
One important concept to consider is what price or part of the cluster has to be reached before you would enter the market? For example, on 13 April the high of the day hit 5011 points and then presented us with an enticing outside reversal signal bar and a very low close. Of the three main parts of the cluster, only one number has been hit, that being the 50% retracement of 4999.5. If the next day was a down day, would you enter short?
Chart 3 – Signal Bar
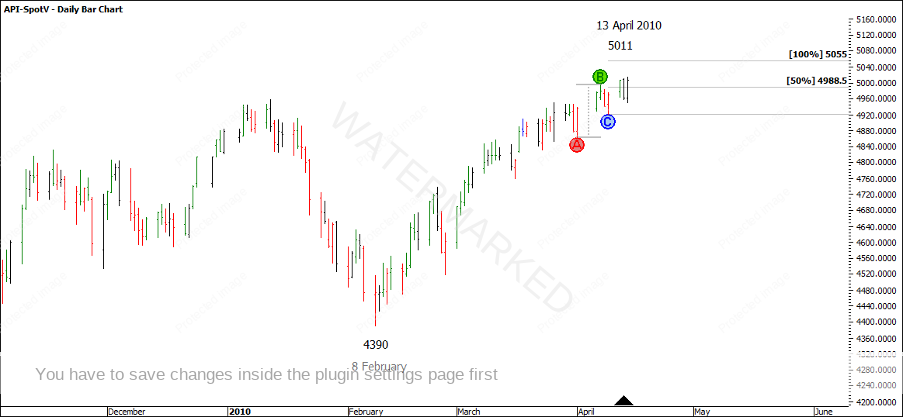
Unfortunately, the next day was another outside bar that possibly would have triggered you in and out of the market all in the one day resulting in one unit of risk loss. This is why you may need to define in advance what price must be hit before you put orders into the market and avoid getting in too early.
Chart 4 – Outside Bar
In many cases the market will reach most if not all of the major parts of a cluster and if you can hold your nerve until then or until you get a definite change in trend, then you may save yourself many losses trying to get set into a position.
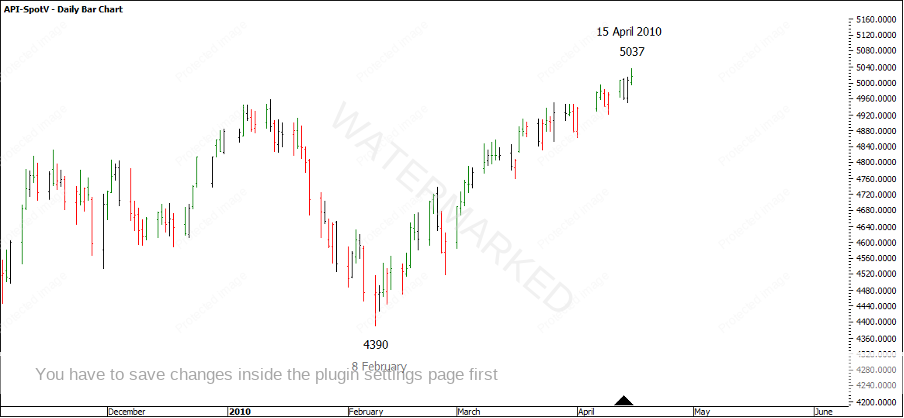
On 15 April, the market hit 5037 which exceeded the highest part of the cluster by half a point.
Chart 5 – 15 April 2010 Top
Looking for signs of completion and form reading go hand in hand and are great topics to study as they can give much more confidence that a price cluster could hold. In Chart 6 below, the 15 April daily bar wasn’t a signal day but the close of the day was below 5036.5 and 2 points below the 400% milestone of the First Range Out. Not only that, but the high of the day fell 2 points short of a 100% repeat in price giving a contracting daily swing range.
Chart 6 – Form Reading
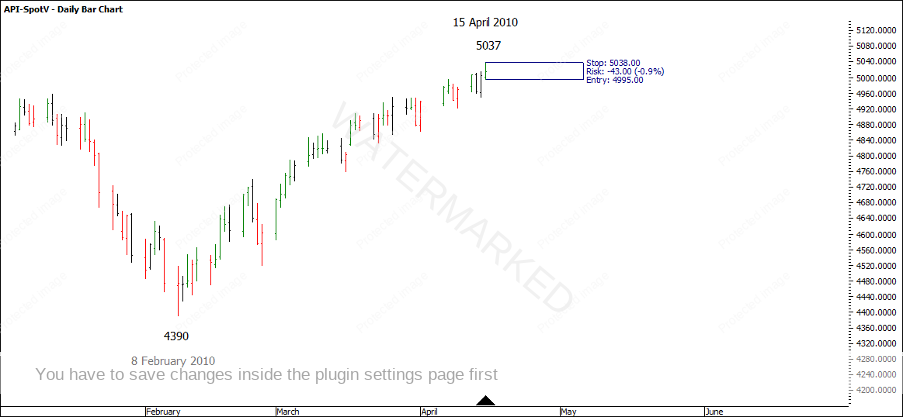
For this case study, let’s use an end of day entry if the market turns down the next day. An entry one point below the low of the day at 4995 and a stop loss one point above the high of the day at 5038 gives a 43 point risk for this trade.
Chart 7 – Daily Risk
To make a 10:1 Reward to Risk Ratio trade, the market would have to drop at least 430 points from 4995 to 4565. Is this achievable? Looking at a Ranges Resistance Card, I see that 4565 is above the 25% retracement level so potentially a 10:1 could be achieved if we believe we’re trading a quarterly or yearly top.
Chart 8 – Quarterly Ranges Resistance Card
The interesting thing about this is that it’s a short sharp drop at the end which makes for a great case study for considering where to exit the market and take a profit.
Let’s use ‘Walk Thru’ Mode in ProfitSource to try and recreate and experience some of the emotion of trading this setup so as to prepare yourself if it ever happens to you. If you want to go one step further to really feel what this period of market was like, hand chart from the start of April to the start of July.
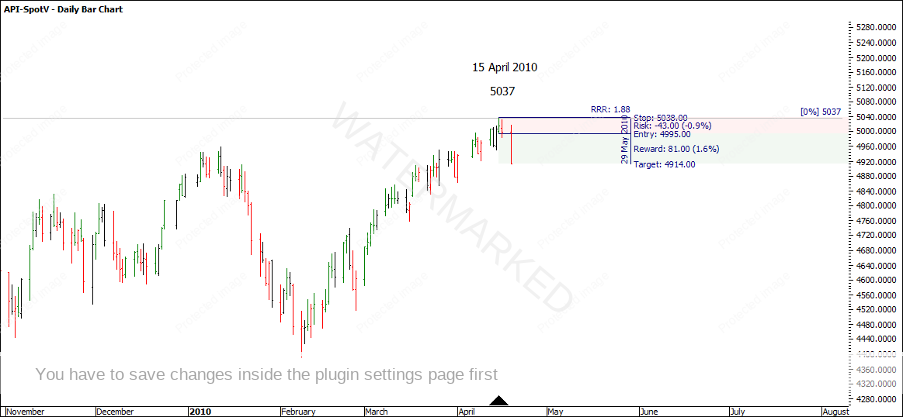
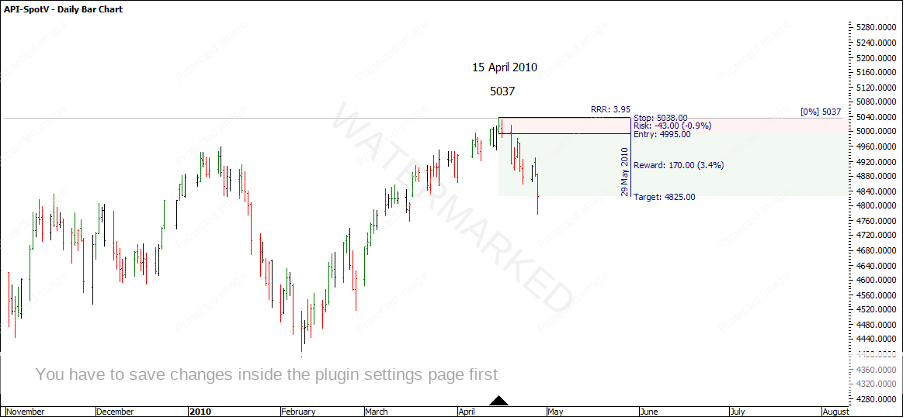
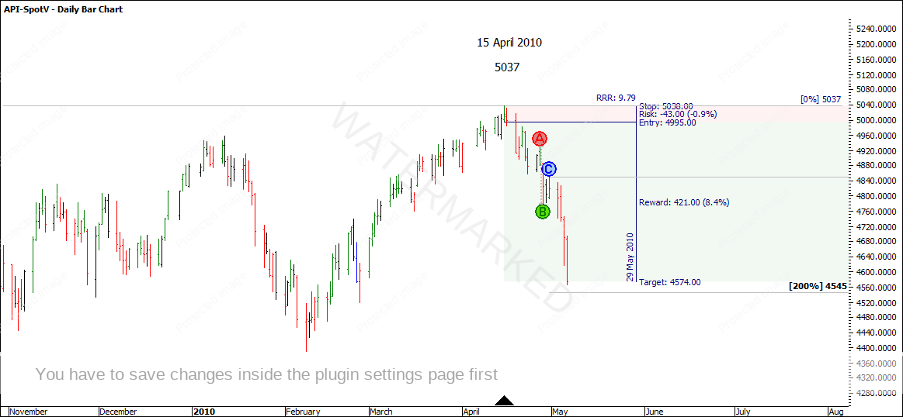
We have our entry parameters as the daily swing chart turns down. Apply the ‘Risk to Reward’ tool and ‘Walk Thru’ mode day by day and adjust the profit target to the close of each day as in the charts below to see how your Reward to Risk Ratio would grow.
Chart 9 – Reward to Risk Ratio – 1.9:1
Chart 10 – Reward to Risk Ratio – 3.9:1
Chart 11 – Reward to Risk Ratio – 9.8:1
By 6 May, this trade was up nearly 10:1 and closing in on the 200% milestone of the last daily swing range. At this point, would you move your stop to lock in profit?
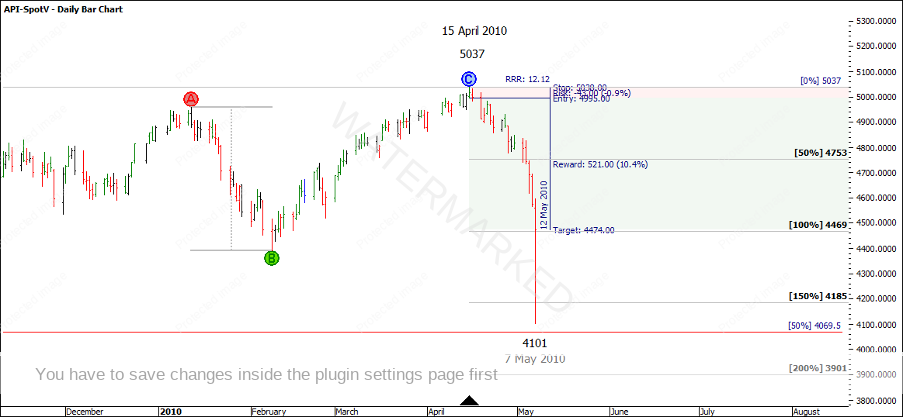
Now take a look at the chart below and just ponder this for a minute, on 7 May, what would you do?
Chart 12 – 7 May 2010
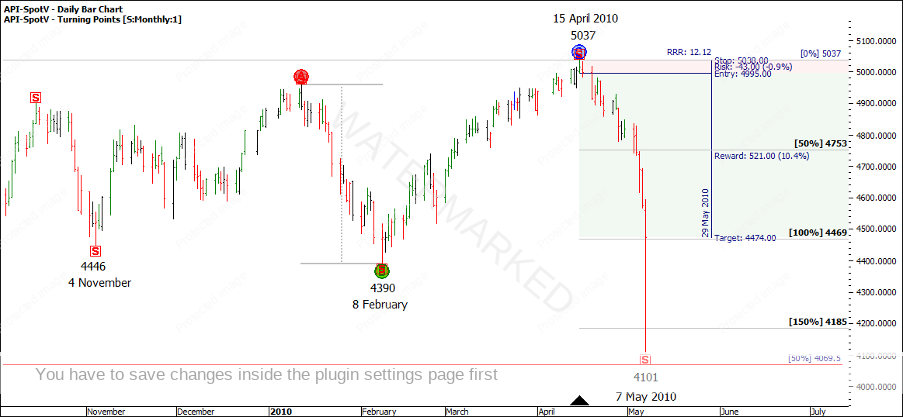
The answer depends on whether or not you were watching intraday or just end of day. However, the trade was up 10:1 at the start of day, then went very quickly to 20:1, then back to a 12:1 by the close of trading!
With the absence of a strong cluster to look to take profits, how would you manage your stops in real time?
In this case, the market had rallied and closed at 4474 points after hitting the 150% milestone of the last monthly swing range then retracing back and closing well above the old lows and just above the 100% milestone.
Chart 13 – 7 May 2010
If you took profits at the end of day you may feel ripped off that your trade went from a 20:1 to a 12:1, however a 12:1 is still a good return and you would have captured 50% of the major move.
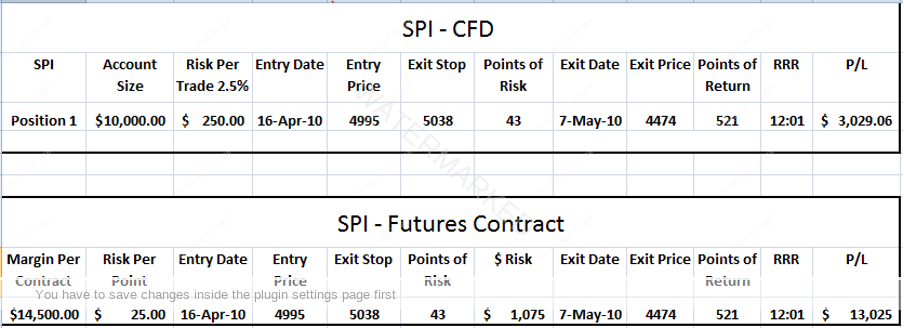
Let’s take a look at the wrap up on one end of day entry comparing a CFD* account and a futures trading account.
I would encourage you to slowly step through each day or hand chart this period for a few months and see how the market unfolded and see what stop loss method you would use to lock in or take profit.
For more information on how to increase your Reward to Risk Ratio, head to the Safety in the Market YouTube channel and check out the latest videos!
Happy trading,
Gus Hingeley
*Note that CFDs for Indices are usually traded at $1 per point. Our risk calculation allows for $5.81 per point, so in practical trading, we would need to choose between $5 or $6 per point for our trade. $6 per point would mean a risk of over $250, so we would therefore choose $5 per point. The Reward to Risk Ratio on the trade would remain the same.
