Keep Banking On
Following on from last month’s discussion on CBA we will again focus on the position of that market and more broadly look at the state of play in banks globally. We are witnessing a structural shift in economies and therefore markets as we drive further into 2022. Banking has changed a lot in 100 years but the fundamental driver of prosperity for bank owners and their shareholders is the ease of access and cost of money.
Inflation has stayed low to non-existent for several years even against the backdrop of printing a lot more money, but in modern terms it’s more the click of a key than the running of the presses. This newfound “money” is then moved on and off-balance sheets around the globe and this has slightly different flow-through effects than just printing paper (or polymer) as we see in Australia. With rates either rising or tipped to rise, the amount of money to be made could increase as loans get a bit more fat in them but this of course is offset by deposits getting a healthier return. Generally rising rates are good for banks but only to a point, and then the balance can tilt and become a negative effect.
We can’t forget that our specialities of a particular market hold great value, but we shouldn’t forget that stocks sit in sectors and certain sectors undergo rotation of assets as economic cycles change and mature. We have seen the tech sector move rapidly during COVID and in 2022 a rebalancing has occurred to more commodities and consumer driven stocks. I do like to understand the strength/weakness of sectors as it can assist in the types of trades I might initiate in the individual stocks.
The XFJ is the Finance sector index in Australia and covers lots of companies that are not banks alone. The US for example has bank-only sectors and MSCI creates a World Bank Index (that includes CBA and Australian banks make up 9.4% of the index value.) This can also offer some insights for our analysis when analysing our charts.
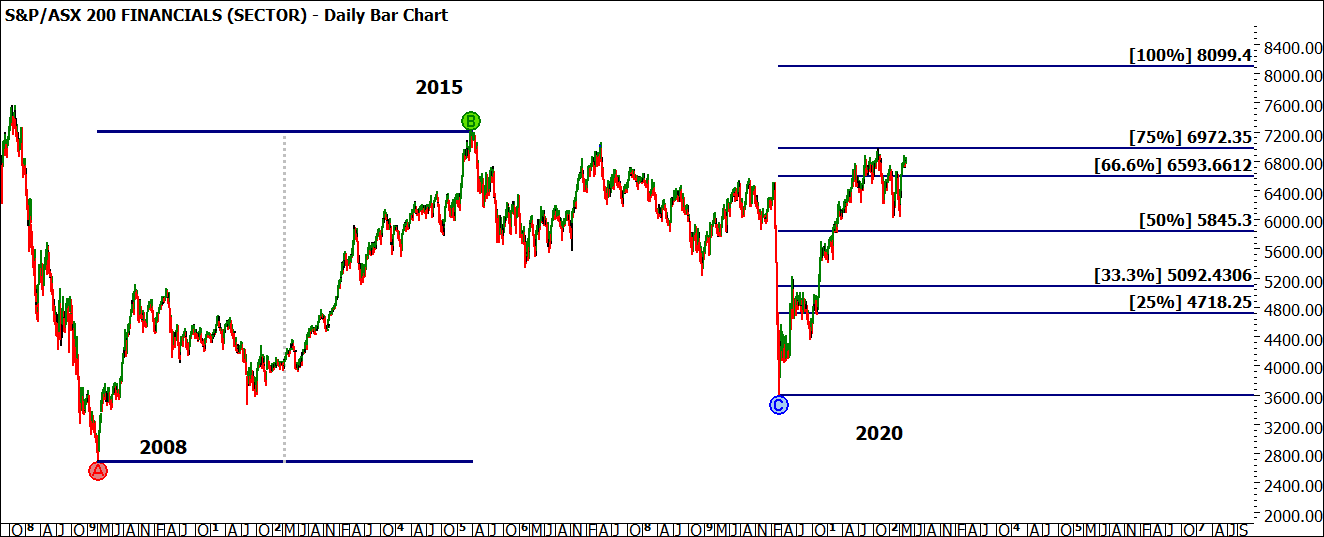
In Chart 1 we can see the milestones of the ABC range acting as points of interest as well. The 6972 level will play an important part in what’s next for the sector. A break above would be a positive for further bullish potential. For those a little further along with your studies I would suggest researching the ABC points I have noted, they all occurred in the month of March and have some interesting symmetry to them.
Chart 1 – Daily Bar Chart XFJ
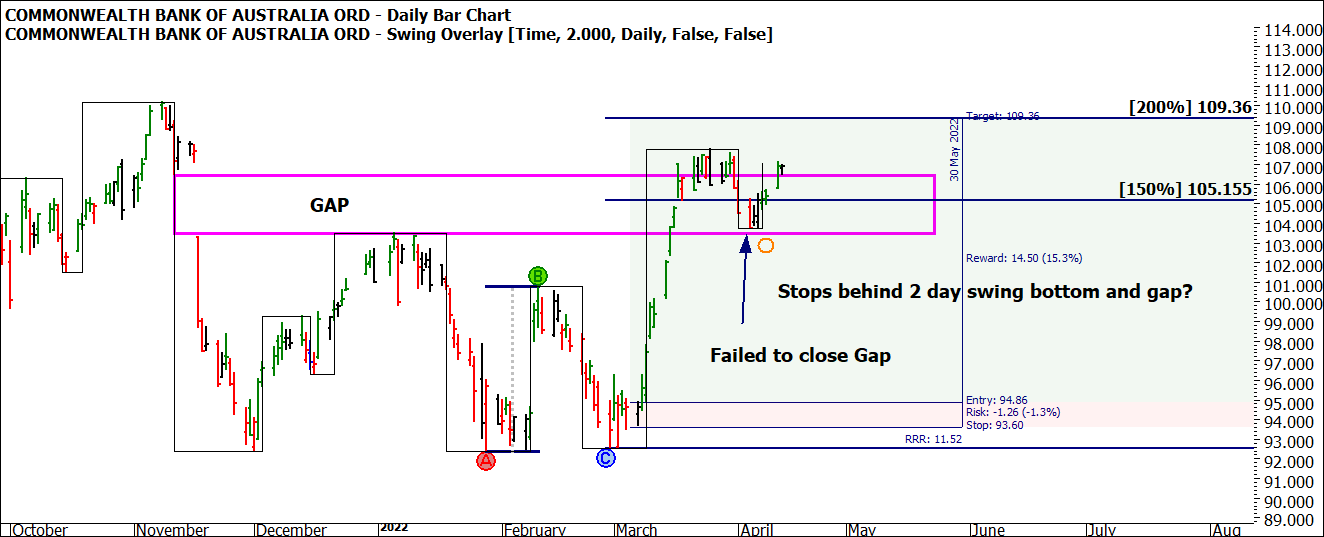
If we focus back on CBA from last month, we can see the double bottoms have played out further to the upside and of interest is the gap that has acted as support. If we update the setup from last month to the current position, the close of the day at time of writing was $106.89. This represents a 9.5 to 1 Reward to Risk Ratio (RRR).
In simple terms for a risk of $1.26 per CFD the return is currently unrealised at $12.03 per CFD.
Chart 2 – Daily Bar Chart CBA
If we can achieve a move to the 200% of the double bottom ($109.36) this will extend to $14.50 return for the same risk, a RRR of 11.5 to 1.
The main challenge with this setup has been the sideways move through Mid-March, which looks to have refreshed the price action and potentially re-energised the move. In times like this understanding the importance and location of the gap has made stop management easier to hide your stops in a safe place.
Again, for the students who are further along their path, you should study the 4th April low and the time harmony around it. Finally on the index that level at 6972 is worth some research time as well. I will be watching closely to see how the market responds if it reaches that level.
Good Trading
Aaron Lynch

