Tricky Triple Tops?
There has certainly been some movement across markets of late, although not at the front and centre of the news as it often is. Other events like the upcoming Australian federal election is getting its fair share of coverage.
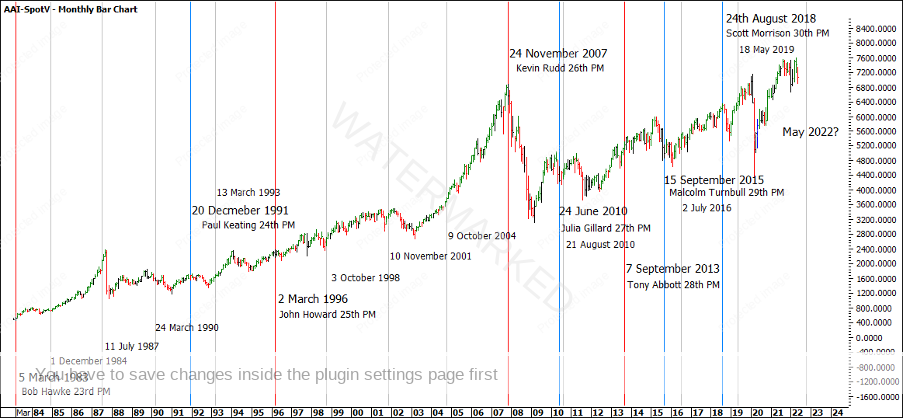
Chart 1 below shows every election date from 1983 against the history of the SPI200. The grey and red lines highlight election dates and the blue lines highlight a change in leadership prior to an election. It’s interesting to look at each date on a daily bar chart to see how the market reacted around these times.
Chart 1 – Historical Election Dates
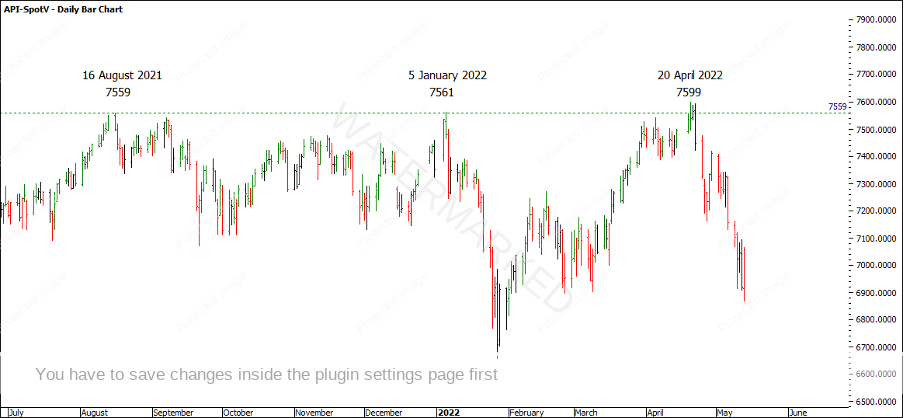
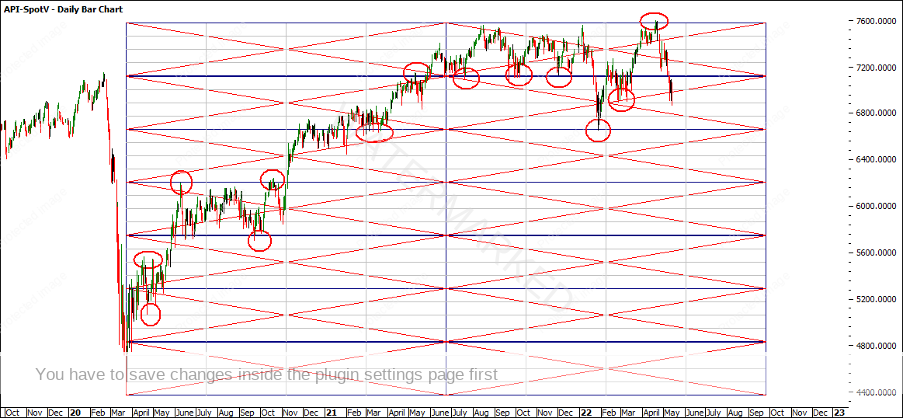
Recent action on the SPI200 has seen the market fall away from triple tops after hitting a price of 7599 on 20 April 2022. Chart 2 below shows these tops and the run downs since then.
Chart 2 – SPI 200 Triple Tops
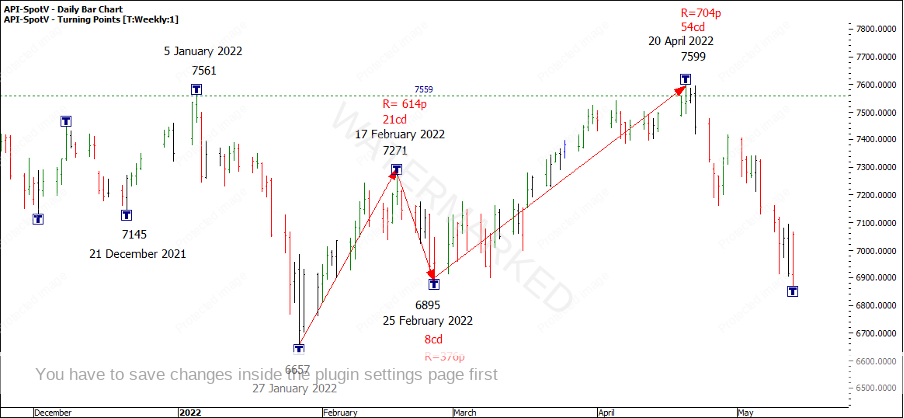
In terms of ‘Chart Setup’ or ‘Position of the Market’, this top didn’t fit the mould of the perfect 3-4 sections, as we only saw two weekly sections with the second section expanding in time and price.
Chart 3 – Chart Setup
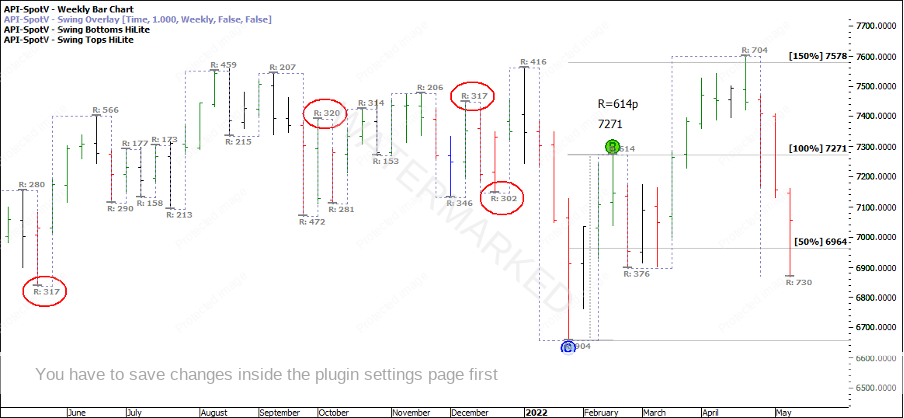
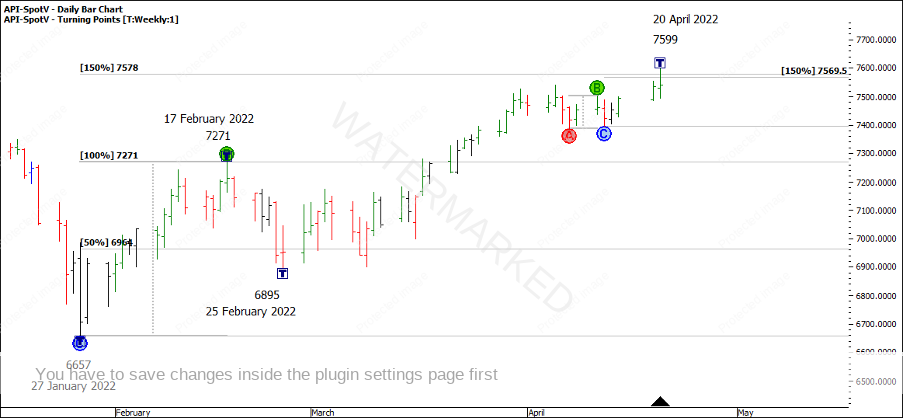
This scenario presents a problem: do you look to take a trade against expanding ranges or wait? Was there significant pressure at these tops to warrant taking a trade? Well, looking at Chart 4 below, 50% of the A-B range of 614 points = 307 points. Looking at the weekly swing chart, we’ve seen ranges of this size over the last 12 months. Adding 307 to the 7271 top = 7578.
Chart 4 – Prime Numbers
The All-Time Low square of 458 once again proves it’s worthiness as 7599 sits just through 7 squares of 458 from the 23 March 2020 low and in the weak part of the square. Also, you can probably see the whole quarterly swing up is just through 2 squares of 458 and the last weekly range up was 1.5 squares of 458.
Just to top it off, using the permanent square of 458 from the All-Time Low, 16.5 multiples of 458 = 7557.
Chart 5 – Square of 458
Looking at the daily swing chart, 150% of the last daily swing range added to the cluster at 7569.5 points.
Chart 6 – Wheels Within Wheels
Taking a look at the smaller wheels of price, 150% of the last 4-hour swing into the top was 7585, and 50% of the last hourly swing into the top was 7595.
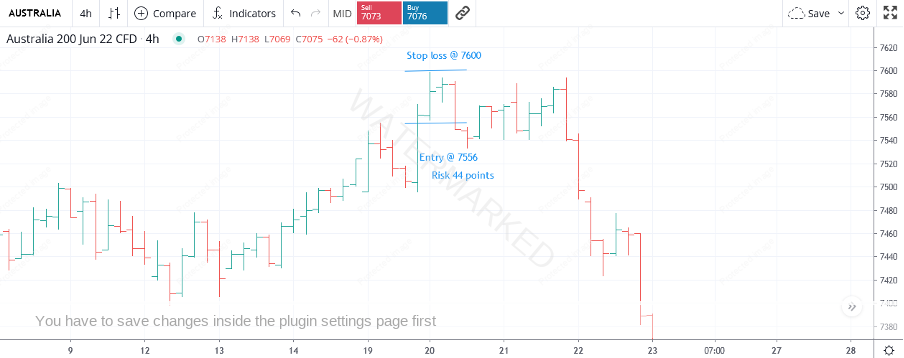
There looked to be sufficient price pressure at this top, so how could have we traded this? As we aim to lower our risk on entry to increase our potential Reward to Risk Ratio, we can look to enter on a smaller swing chart time frame. A mildly conservative intraday entry could have been to wait as the low of the 4-hour bar of 7556 was broken, meaning the market was trading below the lowest of the triple tops of 7559. This would give you a risk of 44 points for this trade.
Chart 7 – 4 Hour Bar Chart Entry
Assuming a $10,000 account and risking 2.5% of capital, our risk would be $250. With 44 points of risk, our position size would be calculated as follows:
$250/44 = $5.68. Using CFDs, we could trade $5 lots or $5 per point, giving us a risk of $220 for the trade ($5 x 44 = $220).
The SPI200 then put in a few strong days down giving us the daily Overbalance in Price. Then we saw the retest of 2 trading days up and a great place to be looking to add to this position or take a first position if you had missed the top.
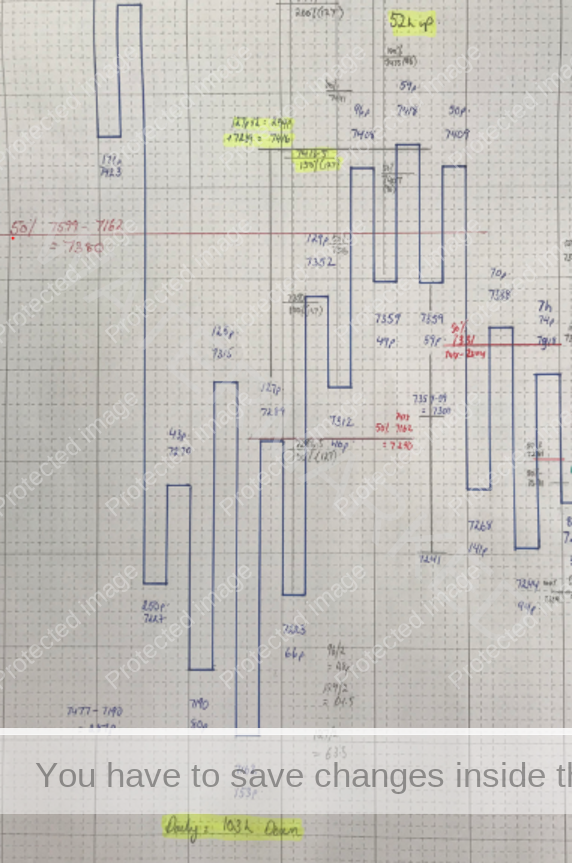
Chart 8 below shows the 4-hour swing chart leading into the 7418 lower top. As you can see there were 4 sections into the top with two sets of contracting ranges, followed by an expanding swing down of 59 points and a contracting swing up of 50 points. The main pressure points are:
- 150% of 127 points FRO (190.5p) = 7413.5
- 2 multiples of 127 points added to the 7162 low = 7416.
- 50% time retracement of 103 hours down and 52 hours up.
- Just through the 50% retracement of 7380
Chart 8 – 4 Hour Swing Chart
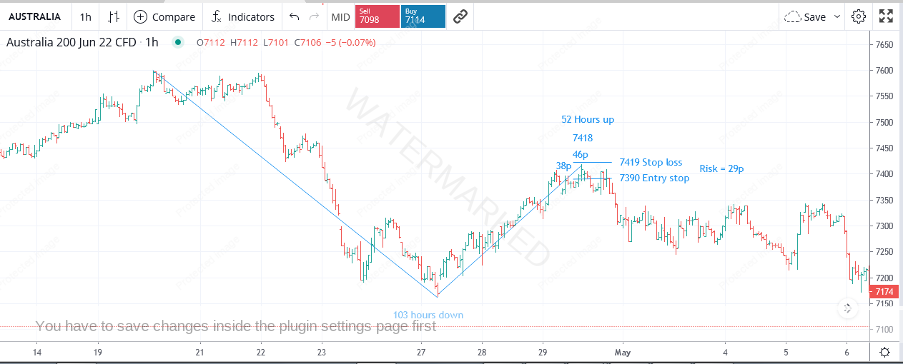
Into the top was a slightly expanding hourly swing range up of 46 points compared to 38 points, however with the 50% time retracement I feel this was one of those times where you can let in a little subjectivity, and enter as the hourly swing chart turned down.
Chart 9 – Balancing of Time
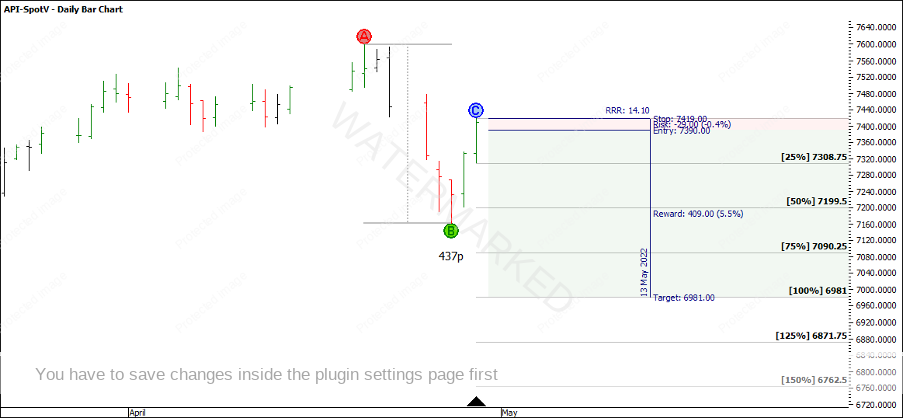
As there were two hourly inside bars after the top at 7418, you could have gained entry one point below the low of the inside bar at 7390 giving a total risk of 29 points. You could now move your stop loss for position one down to 7419, locking in 137 points of profit for trade one and 108 points of profit for both positions.
The 100% of the A-B reference range of 437 points gives a target of 6981 and a potential Reward to Risk Ratio of 14:1 for Position 1 and 13:1 for Position 2.
Chart 10 – Target Risk to Reward Ratio
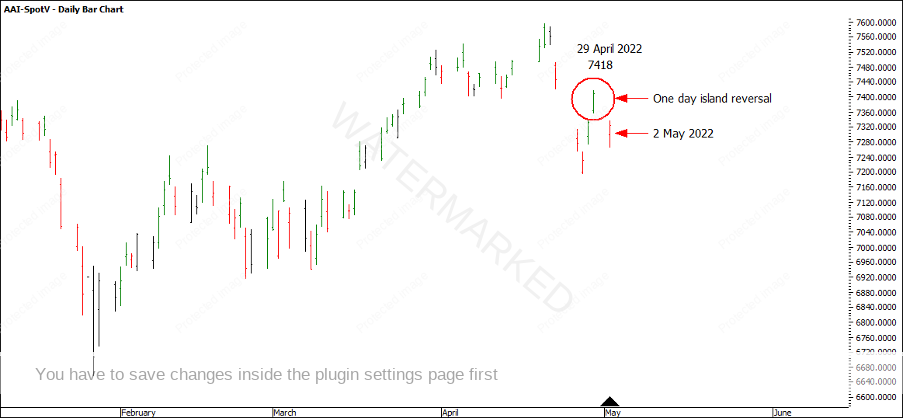
On Monday 2 May, looking at the day only chart (AAI-SpotV), the SPI200 opened with a gap down, never filling the gap and leaving a one-day island reversal pattern.
Chart 11 – Island Reversal
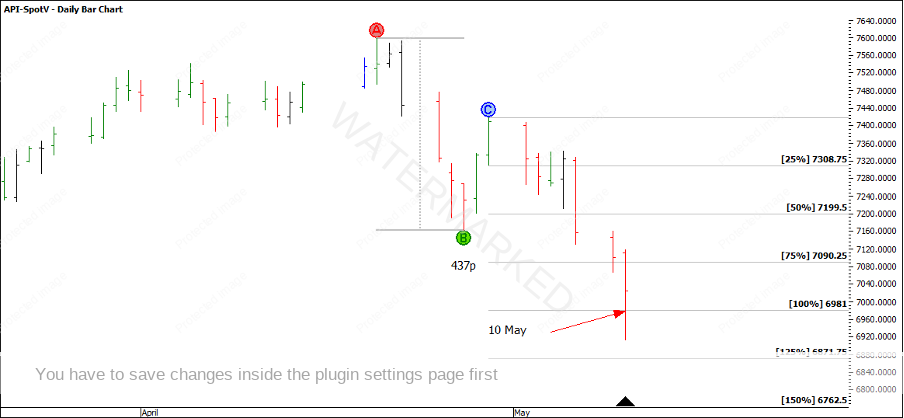
After entry you could have trailed a daily swing stop strategy, until the 100% target was reached. If you had taken profits at the 100% milestone, you would have exited the trade on 10 May for a combined profit of 27:1.
Chart 12 – 100% Exit Target Reached
The end result for this trade was:
Chart 13 – Profit and Loss
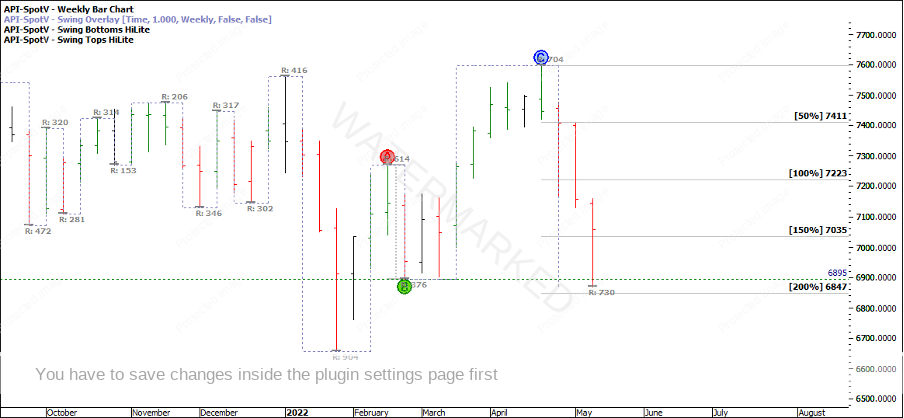
On the weekly swing chart, the SPI200 has made a false break double bottom with the February 2022 low of 6895. However, this one weekly swing down is certainly in the realm of an Overbalance in Price to the downside just falling short of the 200% milestone.
Chart 14 – Weekly Swing Chart
With an election on 21 May, it’s possible we may see plenty of volatility coming up, so stay focused for more trading opportunities!
Happy trading
Gus Hingeley
