Simplicity Over Complexity –
Part 2
In this month’s article, I’m continuing my discussion on the SPI200 from the June Platinum newsletter. To read last months’ article follow the link below.
Revisiting Chart 3 from last month’s article, I applied sections of the market, price ranges, and form reading to build a picture of where this market may have been heading. Then it was a combination of balancing time and Time by Degrees to tie it all together as an area to watch for a potential turn.
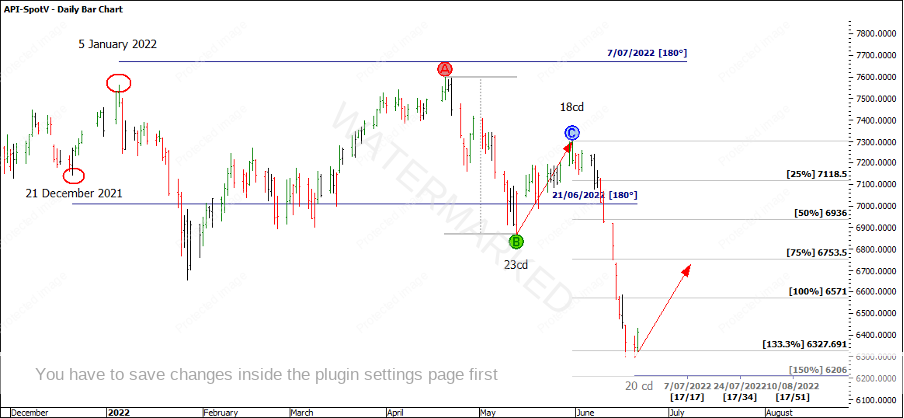
Chart 1 – Time by Degrees Forecast Dates
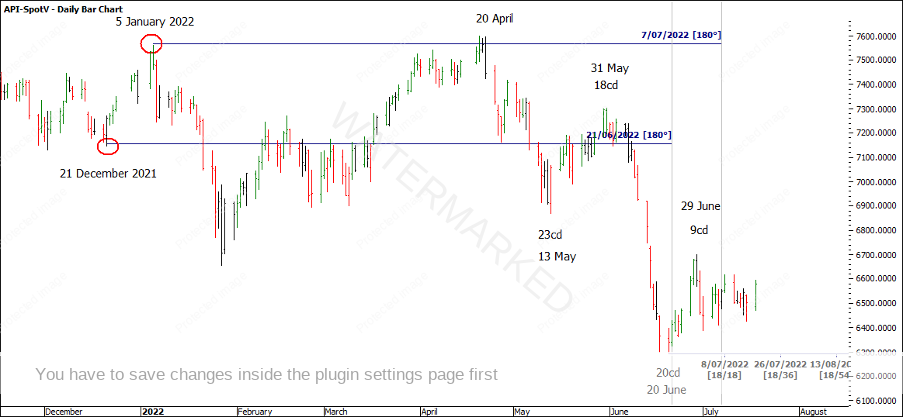
180 degrees from the 21 December 2021 low was within one day of calling the weekly swing low, and thus far, the 8 July daily swing top is just that, a daily swing top.
Chart 2 – Time by Degrees and Current Market
180 degrees isn’t the only degree count you could have marked up on your charts as there is usually more than one working at a time.
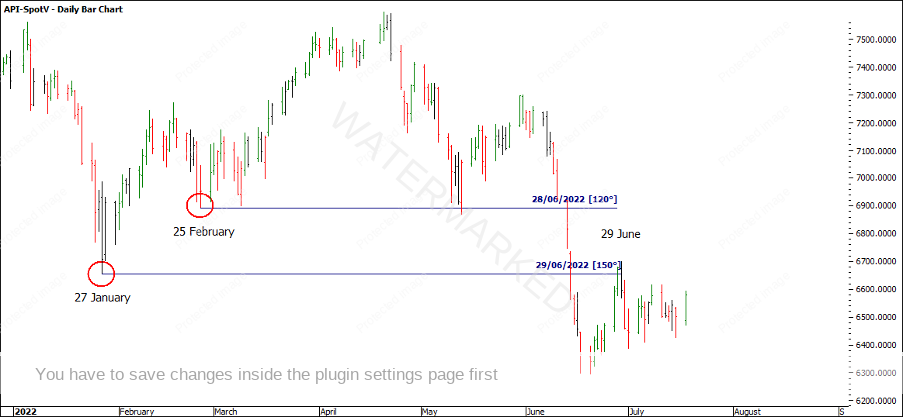
120 degrees relates to the ‘triangle’ within the circle, but what about 150 degrees? 150 degrees is two multiples of 75 degrees, it’s also 90 degrees plus 60 degrees and half of 300 degrees. If you look at the ephemeris and note the actual degree count on 27 January and 25 February, perhaps we could simplify the explanation and say, it’s also when the market has been turning.
Chart 3 – Time by Degrees Pressure Date
An interesting quote from Gann:
A wise man changes his mind, a fool never. A wise man investigates and then decides, and a fool just decides. In Wall Street, the man who does not change his mind will soon have no change to mind. When once you have made up your mind to make a trade and you have a reason for it, do not change without a reason.
Page 18 – 45 Years in Wall Street.
I was thinking about this quote while watching the SPI200 trade up near the 200% milestone of the daily First Range Out from the 20 June 2022 low. Even though the 7 or 8 July looked to be the strong date, the swing charts gave me a reason to re-evaluate.
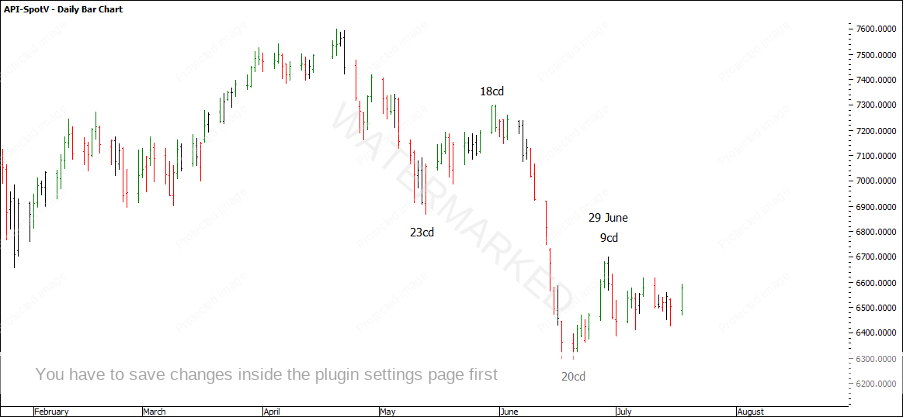
Looking at Time Trend Analysis on the weekly swing chart, a 9 day run up was 50% in time compared with the previous run up of 18 days.
Chart 4 – Weekly Time Trend Analysis
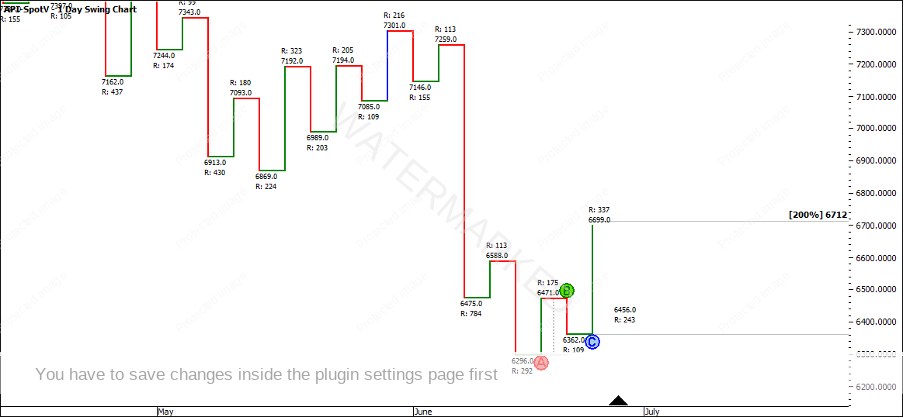
The 200% milestone of the daily First Range Out was 6712, but the market fell 13 points short.
Chart 5 – Daily Swing Chart Milestone
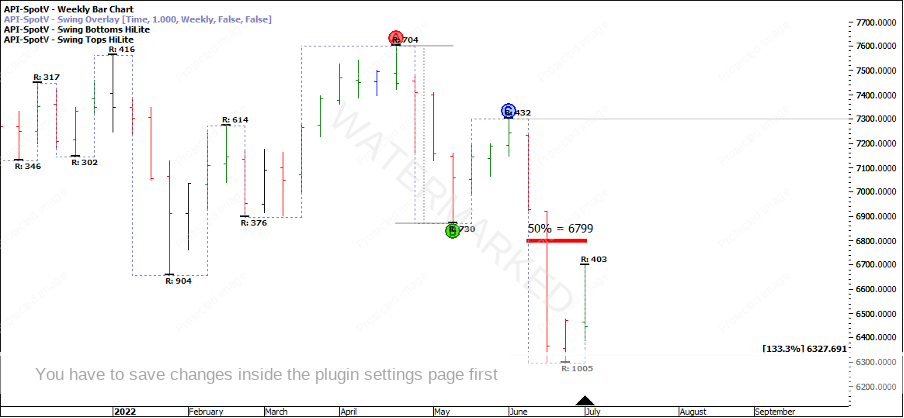
The weekly swing range up at that point showed a contracting swing of 403 points compared with 430 points and still trading below estimated Point C which could be perceived as signs of weakness.
Chart 6 – Weekly Swing Chart
Even though the daily swing fell 13 points short of the 200% First Range Out milestone, was there a cluster?
If you’re keen to have a look, these are a few price reasons that I saw. These are all big picture cluster points, not intraday!
………………………………………….. = 6695 (Swing Range Milestone)
………………………………………….. = 6683 (Multiple of 458)
………………………………………….. = 6657
…………………………………..……… = 6706 (Ranges Resistance Card)
To be honest, I thought the SPI might have snuck up a little higher, but it was an indication of a change in trend on a smaller time frame that put me on red alert.
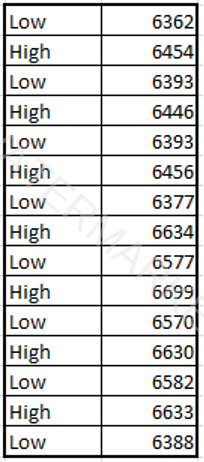
If you drop down to the 4 hour swing chart can you see ‘signs of completion’? Once again, this is where I am going to leave you to have a look. Below is the data for the 4 hour swing chart to draw yourself if you wish, the data always looks better once you’ve drawn the swings!
I shall make it easy and just give you the high and low prices of each swing so it should only take about 5-10 minutes. (You could even do this on a note book and make each line worth 10 points)
What you’re looking for is:
- An indication that the trend has changed
- Identify a potential place for entry based off sound swing charting rules.
Chart 7 – 4 Hour Swing Chart Highs and Lows
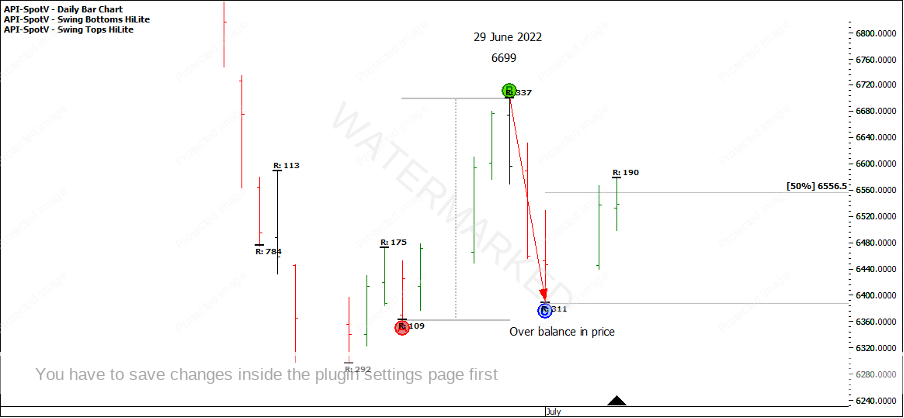
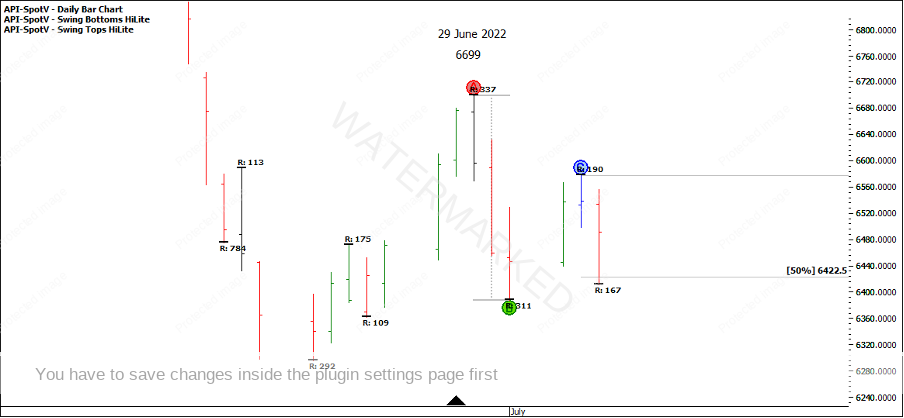
Back to looking at the daily swing chart, the SPI200 then put in a large overbalance in price to the down side followed by a failure to the upside at the 50% milestone.
Chart 8 – Daily Bar Chart
However, the very next swing down also failed at 50% and the day closed high, not a good sign!
Chart 9 – Failed Daily Swing at 50%
Since then, the SPI has been up to its old tricks, trading in a tight sideways range while it works out which way to go. If you had been short this market, you may have moved stops to entry plus commission and be sitting on the sidelines with a break even.
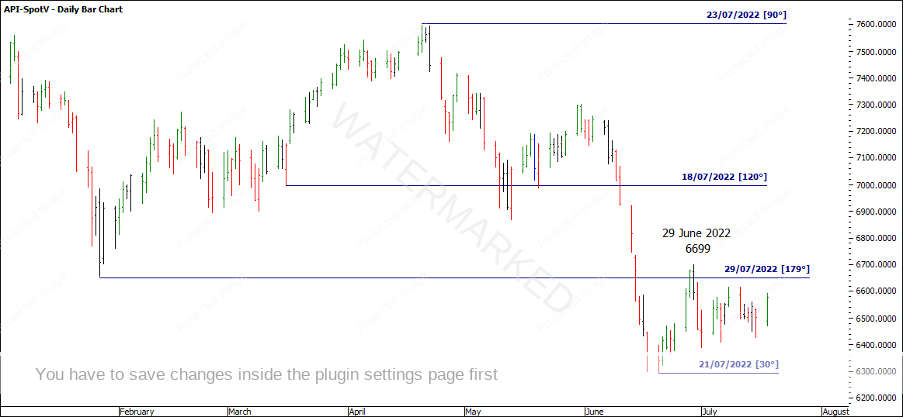
But don’t take your eye off the SPI just yet, as it soon approaches the next Time by Degrees dates.
Chart 10 – Next Time by Degree Dates
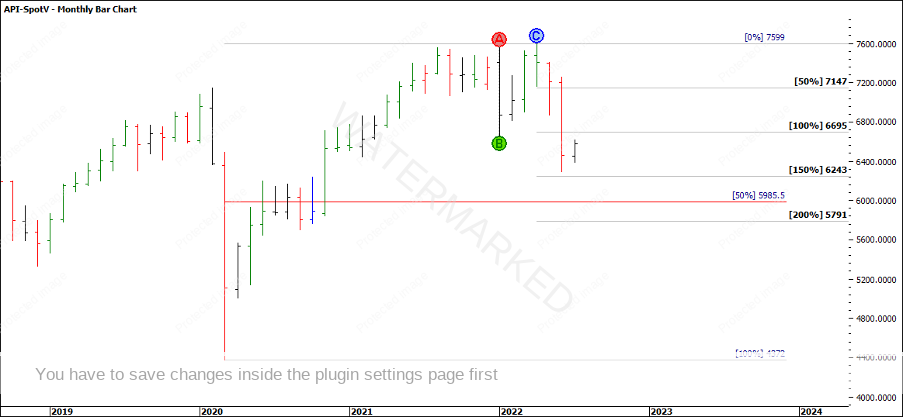
If the SPI heads back down again, we can combine all the swing range milestones from the yearly, quarterly, monthly, weekly and daily to look for places where this monthly swing may come to an end.
Chart 11 – Bigger Picture Monthly Ranges and Milestones
If the SPI continues up then we wait for the next Classic Gann Setup to present. As always, the swing charts will tell the story!
Happy Trading,
Gus Hingeley
