Trader A Trader B
I love seeing ranges repeat or clear percentages of ranges repeat. It’s fascinating to consider why it happens, and the cause. Still, we don’t need to know the ‘why’ to be able to identify a tradable cluster of milestones.
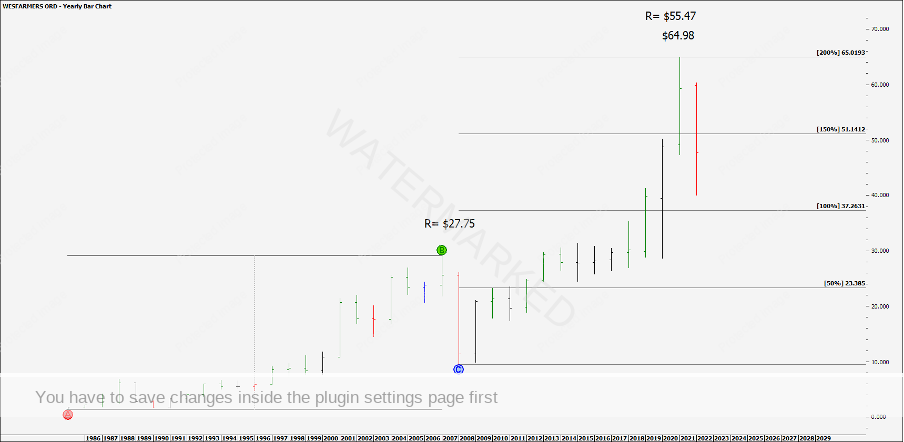
This month’s case study focuses on the stock Wesfarmers (ASX: WES). Looking at the biggest range possible, the current All-Time High comes in 4 cents short of an exact 200% milestone of the 22 year bull market range. Not bad!
Chart 1
This stock had a significant turn at the 50% milestone which is interesting as that is a yearly First Range Out that we could also run our ABC milestones over.
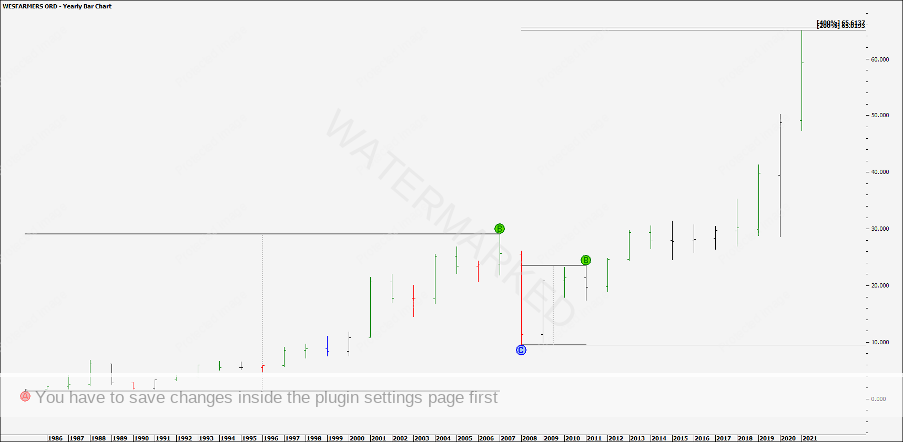
The application of David’s 256 point lesson from the Number One Trading Plan would give a price milestone of $65.61. This is slightly above the current top but still helps to build a picture of this market.
Chart 2
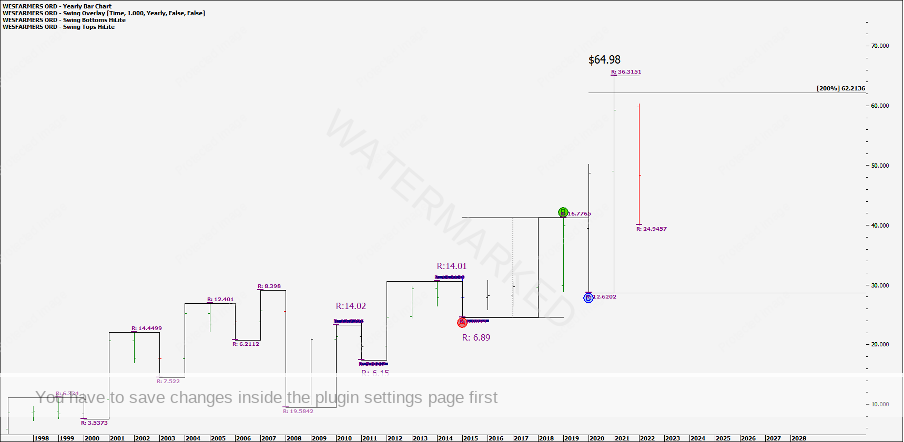
The yearly swing charts show that Wesfarmers is in a 4th yearly swing up from the 2008 GFC low, with the last yearly swing just going through the 200% milestone at $62.21.
Chart 3
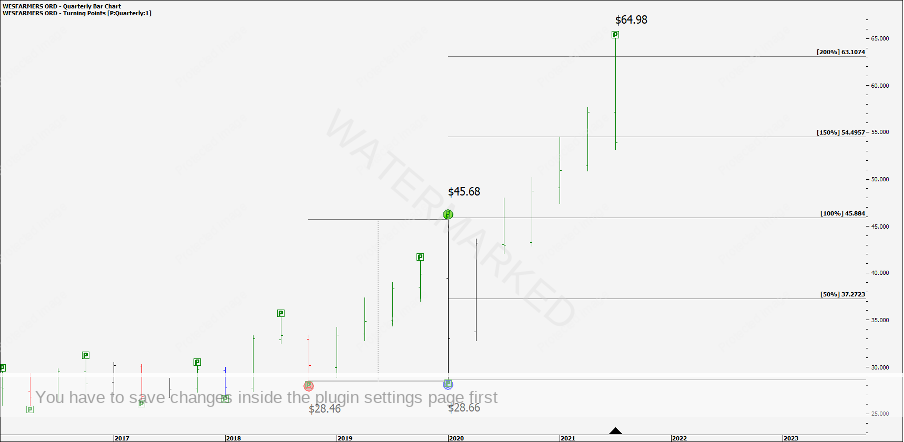
Let us now take a look at this last yearly swing up, using the next time frame down, the quarterly swing chart. As you can see below this yearly swing is all one quarterly swing. However, if we still apply our ABC milestones to the last quarterly swing chart Double Bottom, the 200% milestone gave us $63.10.
Chart 4
So very quickly there are some big seasonal ranges coming in on known percentage vibrational levels.
As David says:
“It’s from yearly or seasonal ranges that you get the ability to call the big moves. There is no other way”
David Bowden, P147 – Number One Trading Plan
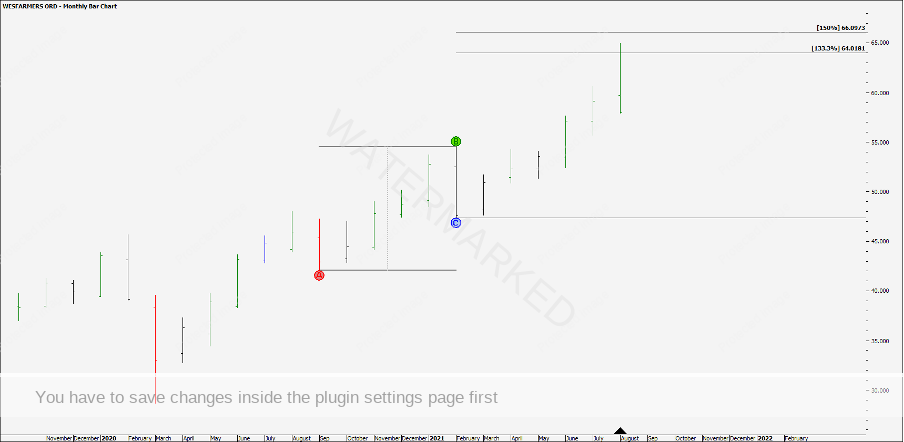
Taking a look at the monthly swing chart I can start to see a few challenges. The last monthly swing went a little bit through the 133% milestone although short of the 150% (possible Point A) milestone.
Chart 5
Do you need to trade the exact extreme tops or bottoms every time to get a high Reward to Risk Ratio trade though? Definitely not, we can always let the market give us an indication that the trend has changed and, in this instance, wait for a big picture lower top setup.
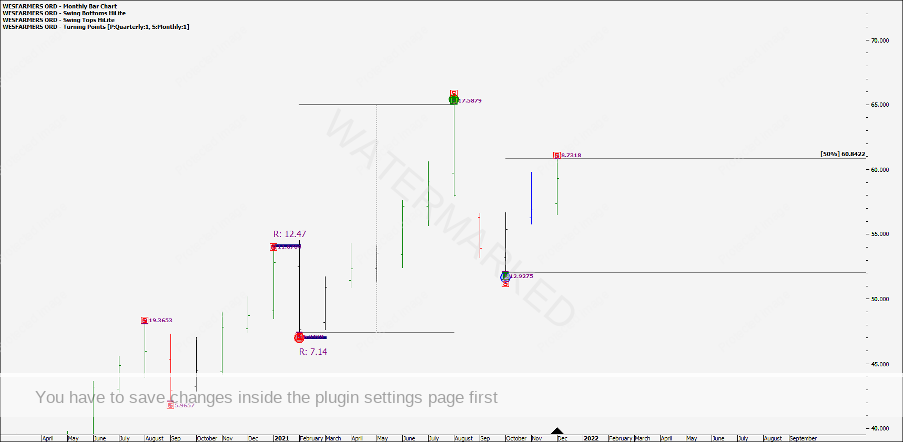
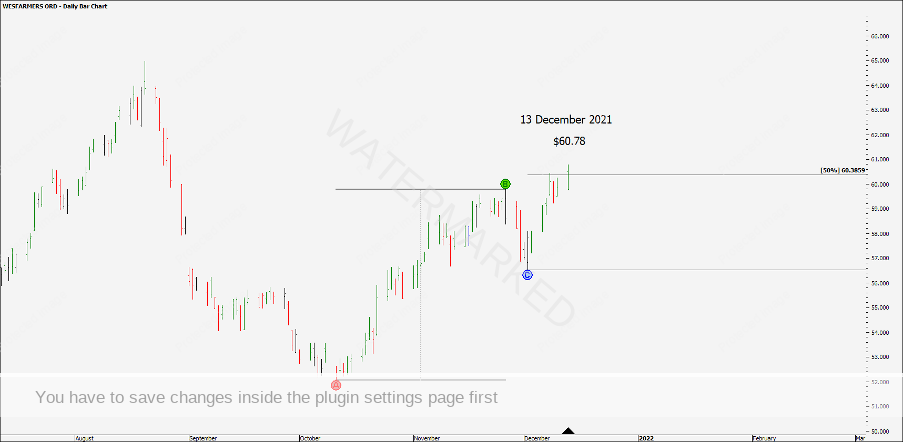
This stock put in an expanding monthly swing range down of $12.92. A good place to be watching for this swing move up to fail would be 50% of the previous monthly swing range at $60.84.
Chart 6
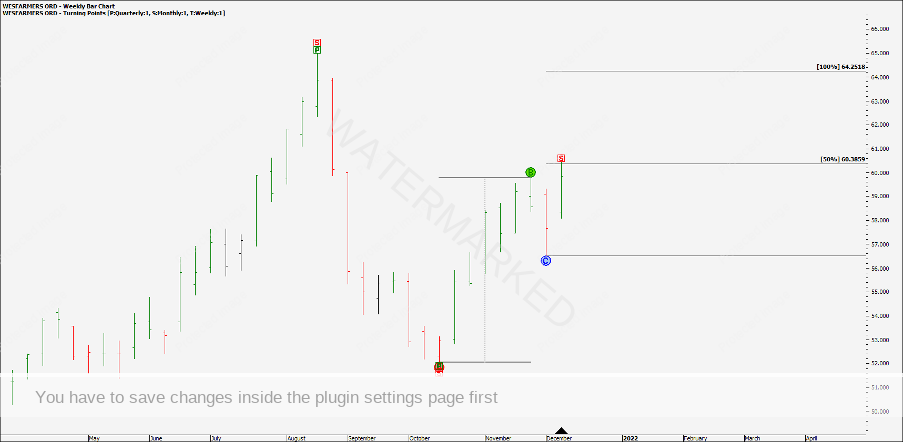
Dropping down to the weekly swing chart, 50% of the last weekly swing = $60.38.
Chart 7
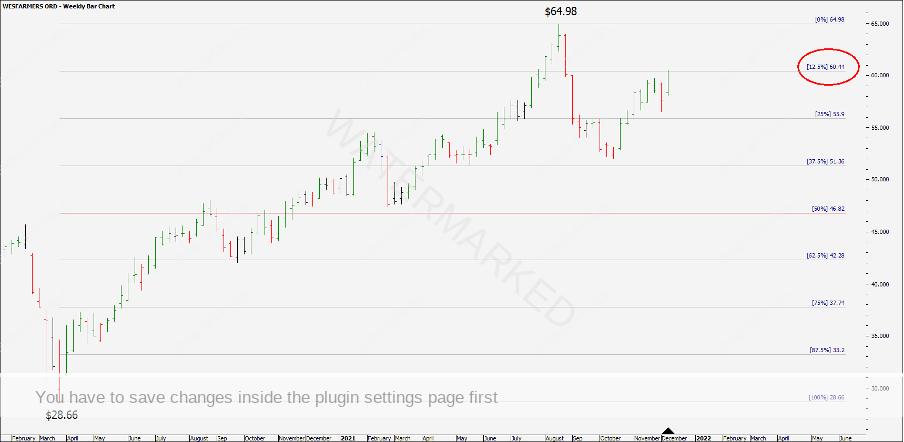
For a third piece of the cluster, the 12.5% Ranges Resistance Card milestone of the $28.66 COVID low to the $64.98 high equals $60.44.
Chart 8
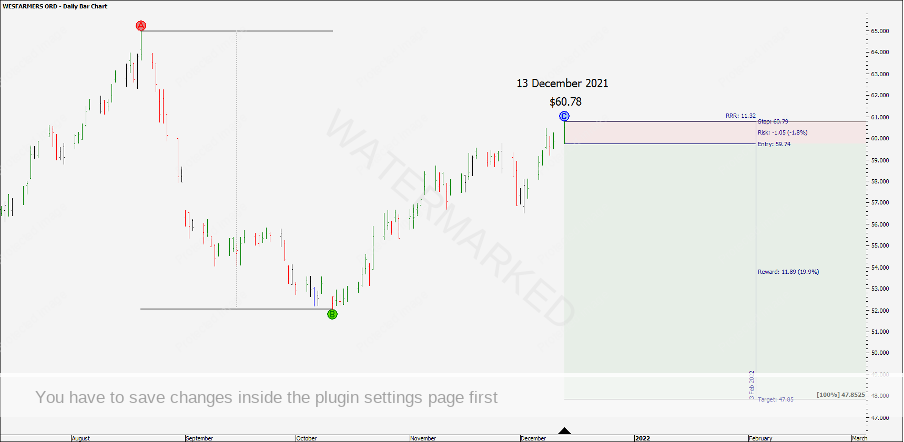
On 13 December 2021, Wesfarmers topped at $60.78 then ran down to present a great looking signal bar with a very low close after a contracting daily swing up. The close of the day was well below the weekly 50% milestone. You could have orders in for the breaking of the low as the daily swing chart turns down.
Chart 9
With a 100% target of the monthly swing range, this trade would give a potential 11.32 Reward to Risk Ratio.
Chart 10
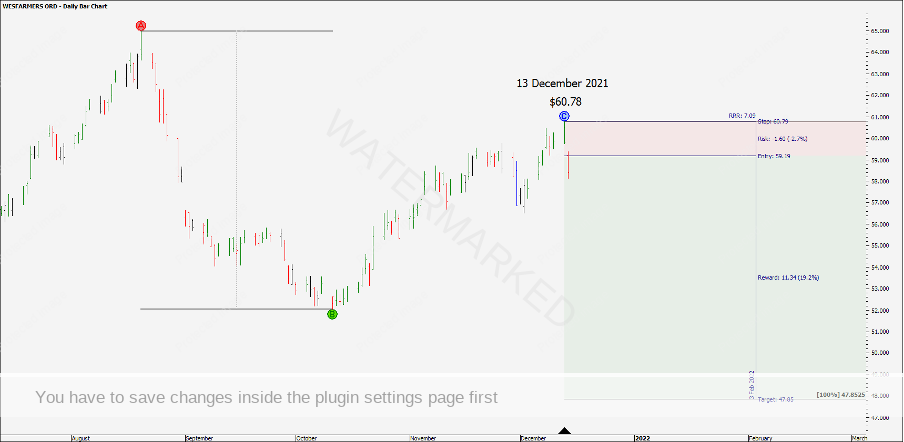
The next day the market gapped down on entry greatly increasing the points of risk for this trade, bugger! If you entered intraday after the gap down as the market broke back below the open price of $59.19, this now gives a 7:1 Reward to Risk Ratio.
Chart 11
Do you take the trade? This is where you need to have something written into your trading plan that tells you to enter or not, so you don’t have to make a decision based on emotion.
Let’s say Trader A takes the trade and now has a potential 7:1 Reward to Risk Ratio trade ahead if Wesfarmers hits the 100% target of $47.85.
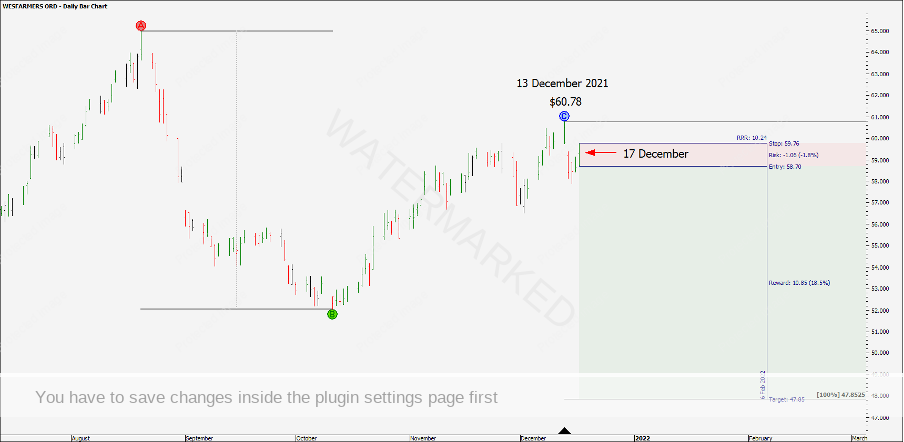
Trader B prefers a higher Reward to Risk Ratio and decides to wait for a first lower swing top entry.
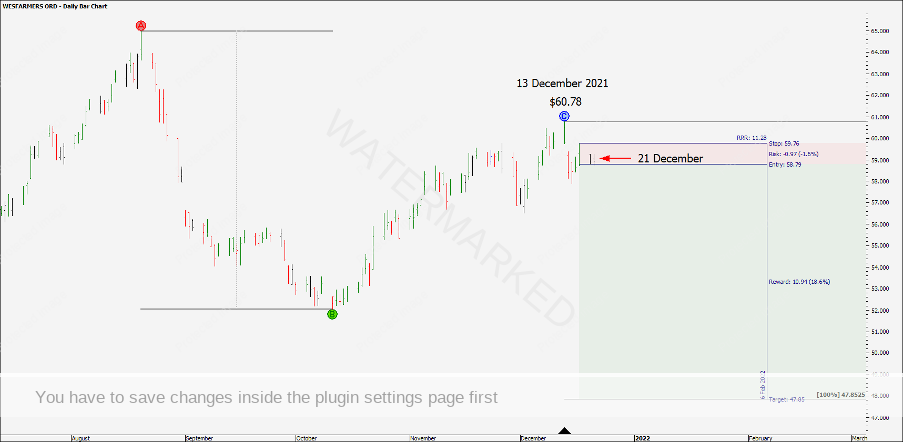
On 17 December 2021 the market provides another strong signal bar for a first lower swing top, this time with a risk of $1.06 and a potential 10:1 Reward to Risk Ratio.
Chart 12
The following day is an inside day which means the entry stop is now at $58.79 and has a potential 11.2:1 Reward to Risk Ratio ahead. The following day the market trades lower and the trade has been triggered for a first lower swing top entry.
Chart 13
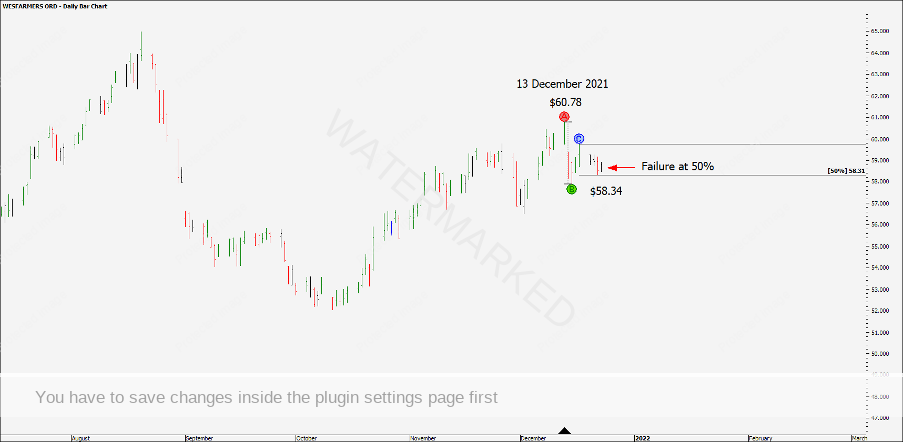
Two trade days later and Wesfarmers fails to reach the daily 50% milestone and gives a small inside day with a high close, not a good sign!
Chart 14
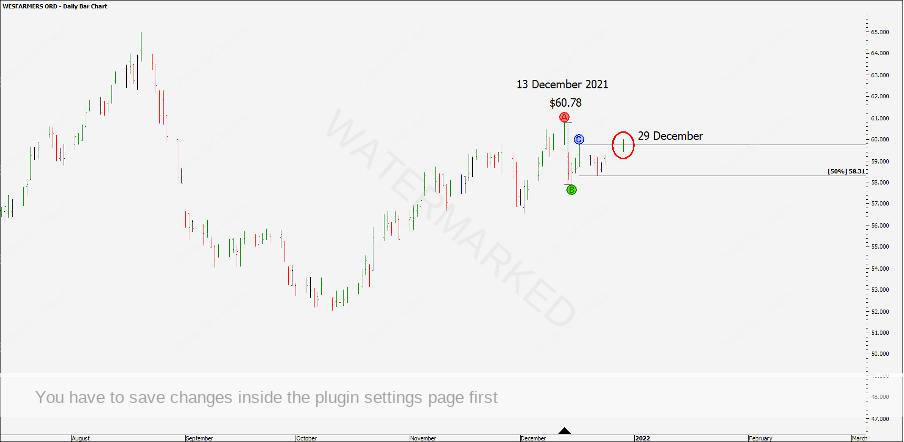
The following day the market confirms a higher bottom, and on 29 December the market runs up and stops the trade out for a loss.
Chart 15
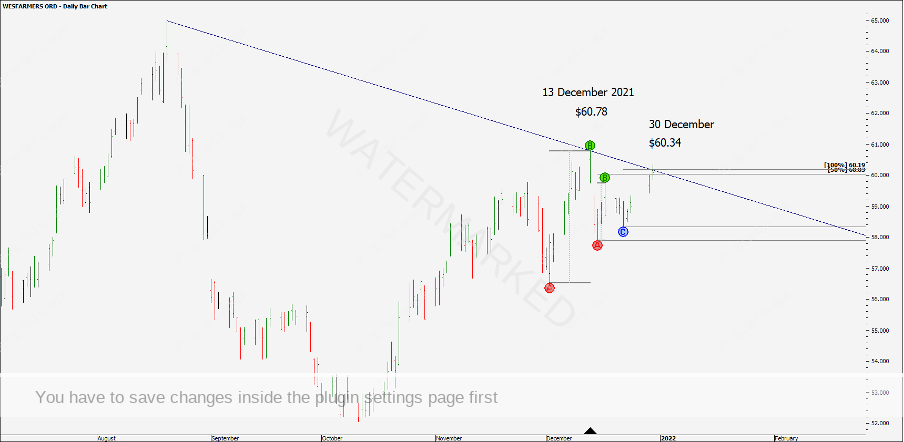
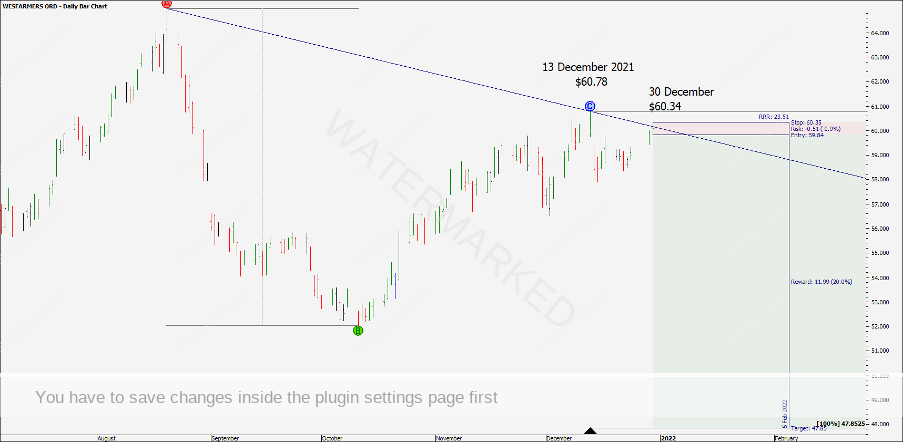
Trader B reassesses and looks for the next cluster. On 30 December, Trader B notices 50% of the previous weekly swing = $60.03 and 100% of the daily swing = $60.19, while running into a trend line that connects the previous tops.
Chart 16
Putting an order in to enter as the daily swing chart turns down with an exit stop one point above the high of the day now gives Trader B a total risk of $0.51 cents and a potential Reward to Risk Ratio of 23.5:1! Halving the risk, doubling the reward.
Chart 17
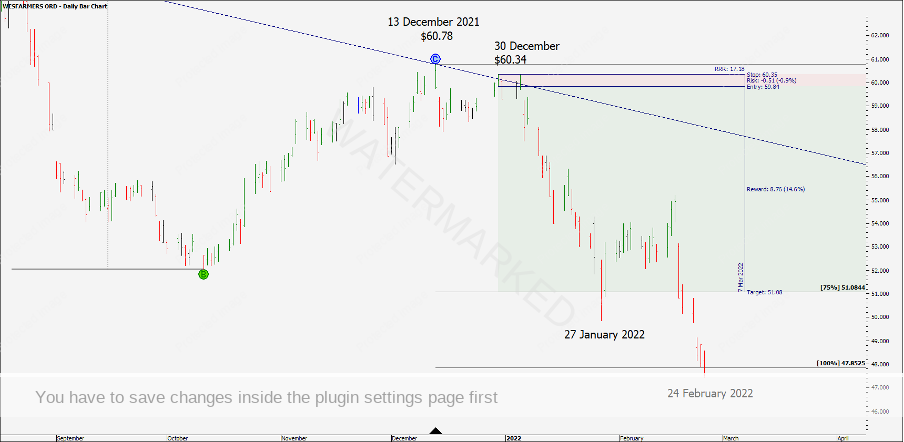
This trade was triggered the next day and after a couple of nerve-wracking days the market took off to the downside.
Depending on your style of stop management or exit target, an exit at 75% of the previous monthly range would have netted Trader B a 16:1 Reward to Risk Ratio (17:1 minus one loss)
Managing the trade to the 100% milestone would have netted Trader B a 22.5:1 Reward to Risk Ratio (23.5:1 minus one loss), whereas Trader A could have banked a 7:1 Reward to Risk Ratio with one entry and no loss.
Chart 18
Being patient and waiting for the right setup to come together can pay dividends!
Happy trading,
Gus Hingeley
