Outcome or Process?
I never lose. I either win or I learn – Nelson Mandela
A powerful quote, especially when it comes to trading profits and losses. I know myself, I can experience the emotions of trading after a win, loss or a breakeven if I don’t keep them in check. A succession of wins can heighten confidence levels, whereas being on the sidelines, not in a good trending move or taking a loss can decrease confidence.
Someone reminded me recently that trading should be unemotional, that we should disconnect from the outcome and focus solely on the process and adherence to our trading plan. We should then look for opportunities to improve the process over time. My trading process can be simplified into 4 steps:
- Analysis plan (Identifying a Classic Gann Setup)
- Entry plan
- Trade management plan
- Trade review
A recent example was a short trade on the SPI200. My analysis plan identified a potential trading opportunity.
My entry plan was then triggered on a 4-hour swing chart, with a small risk on entry and a large potential Reward to Risk Ratio ahead.
After one day down, the SPI turned around and shot back up resulting in a loss. What!? I followed my analysis plan, I followed my entry plan and I followed my stop management plan and it was still a loss!
Initially on my trade review, I noticed a range of emotions and rated them as follows:
- Frustration = 8/10
- Disbelief = 8/10
- Disappointment = 8/10
If I rated my performance on the outcome, I would have to rate it ‘Poor’ as the trade was a loss although that would be outcome focussed. However, If I rate my performance on adherence to process, I have to rate it ‘Good’ because I followed my plan. So why should I be frustrated or disappointed?
Perhaps a better question would be “is there an opportunity to adjust or tighten up my analysis or stop management plan to reduce the amount of drawdowns and increase the win/loss ratio?”
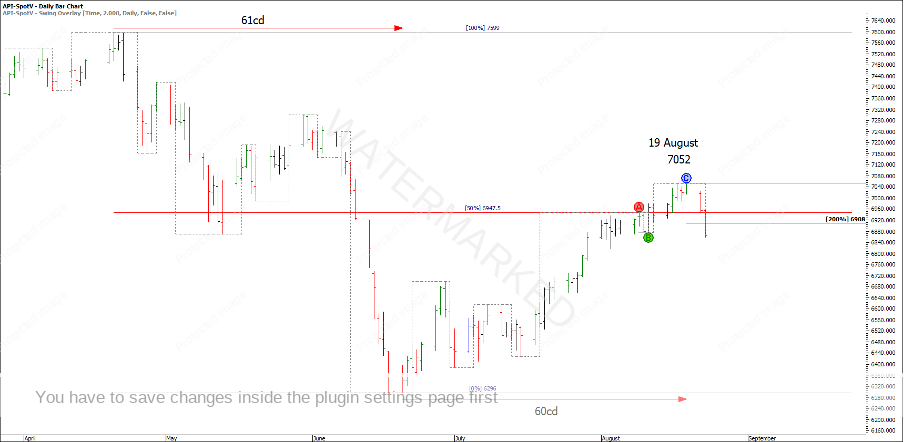
Looking at where the SPI is currently, there is a weekly swing top at 7052 on 19 August. The 2-day swing chart has now well and truly overbalanced to the downside and broken back through the monthly 50% retracement of 6947.
Chart 1 – Weekly Swing Top
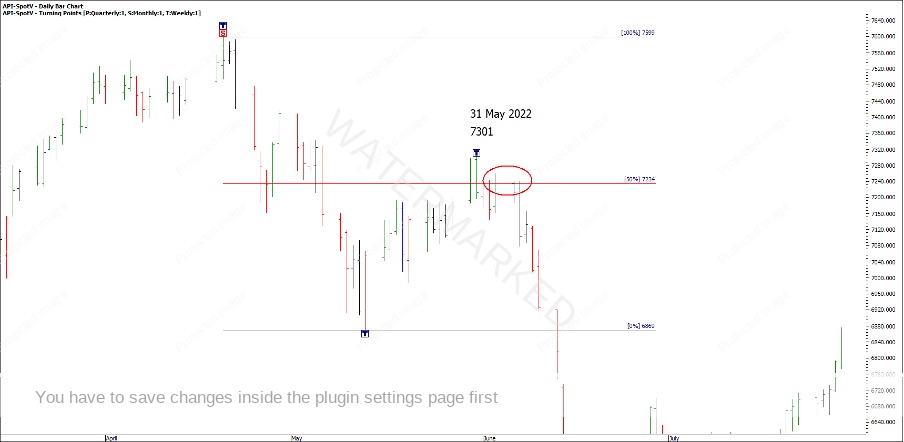
Where have we seen this before on the SPI? It was the weekly first lower swing top back in May this year that broke through the 50% weekly retracement, then came back to make a lower top right on the 50% level. Maybe we will see this happen again, maybe we won’t, but this is a common occurrence across many markets and one area worth watching.
Chart 2 – First Lower Swing Top Under 50%
What other scenarios that played out here fit your analysis plan or tick the boxes for a Classic Gann Setup?
No doubt everyone will be slightly different in their analysis, even though we use the same analysis tools. The main thing is that you develop your own plan to suit your personality and follow it, learn from it and look to improve it over time.
Often we may hear someone else’s opinion on a market direction, but it shouldn’t affect your judgement if you know your setups.
Happy trading,
Gus Hingeley

