High Probability Trades
If you could develop your own ‘niche’ trade setup – the one setup that resonates with you more than others and one you could look for across different markets and time frames – what would it be?
A setup I’ve come to appreciate is a price cluster that forms at the 200% milestone of a First Range Out. There are a many “First Range Out’s” on different time frames, so the bigger the time frame you choose to run a First Range Out, the bigger the move you may expect out of a cluster. For example, 200% of a 5-minute First Range Out might only give you a turn on a 1-hour chart, where the 200% of a weekly First Range Out might give you a monthly turn.
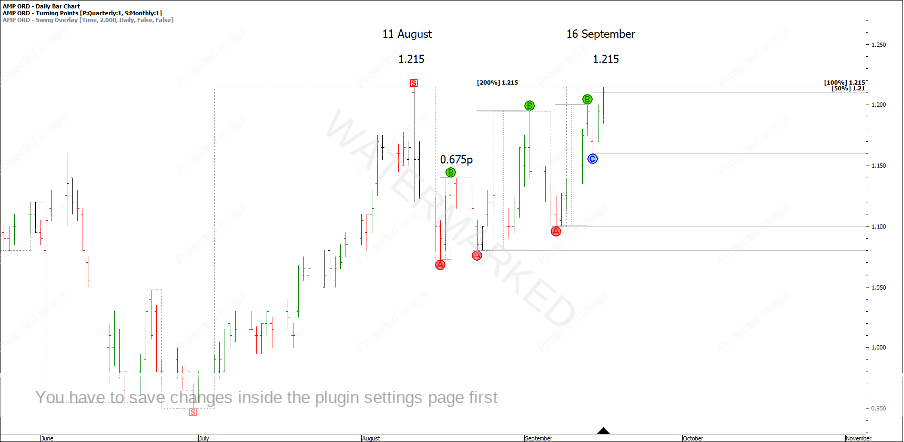
Let’s examine a recent example on an Aussie stock, AMP. The stock was showing 200% of a 2-day First Range Out that clustered with a 100% repeating 2-day swing range into double tops. The 50% milestone of the last daily swing also tied into the cluster.
Chart 1 – AMP Setup
You can also break down that last daily swing into its own hourly swings, which was a great indication that the daily swing had come to an end. This example shows signs of completion on multiple time frames.
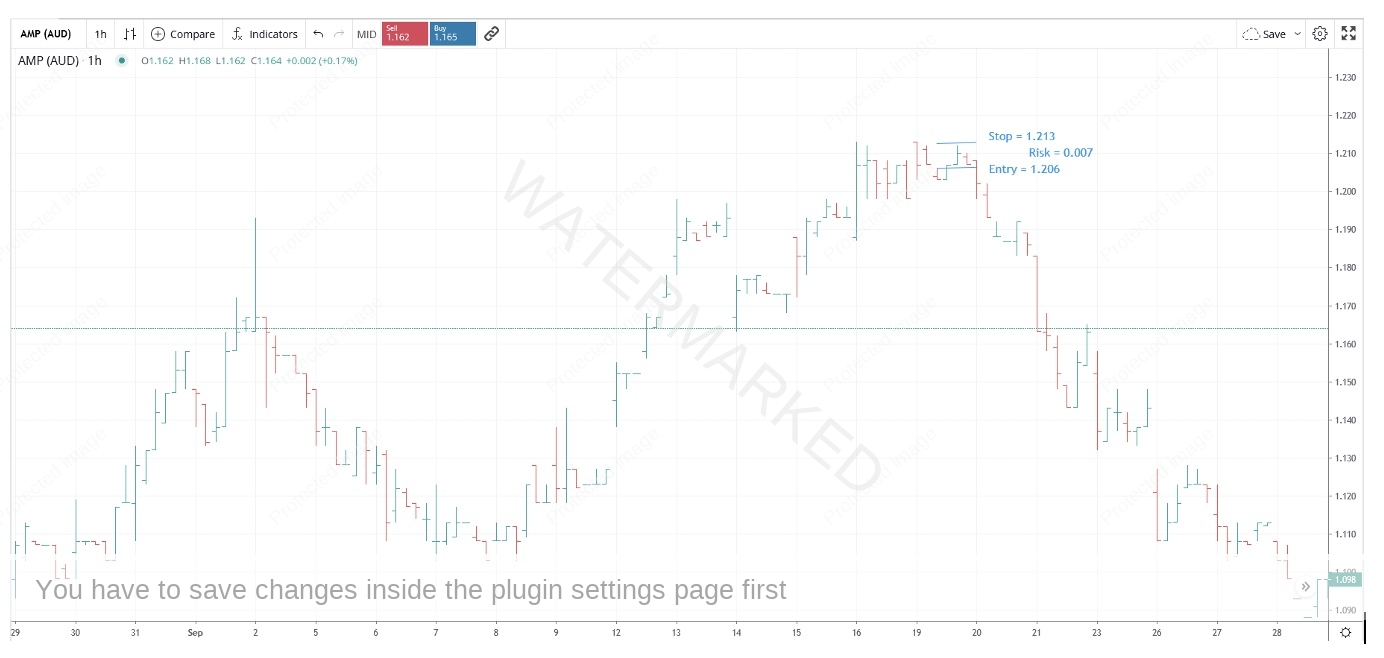
Just like that, the setup is identified! Next is to look for an entry bar that provides a small enough risk to give the potential for a large Reward to Risk Ratio. Keeping on the hourly bar chart, can you see potential entry into this trade? I liked the 1 hour first lower swing top entry that provided 7 points of risk that ended up giving this trade the potential for a 19:1 Reward to Risk Ratio!
Chart 2 – 1 Hour Entry Bar
It is interesting that the 200% milestone was present at the start and end of the trade.
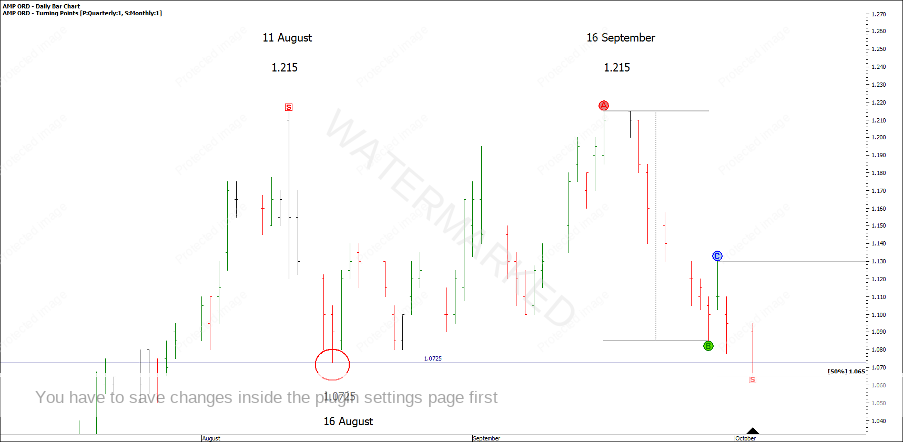
Looking at Chart 3 below, AMP ran down in two daily swings into double bottoms, with the second daily swing pulling up on the 50% milestone after a false break of the previous weekly low.
Chart 3 – Double Bottoms
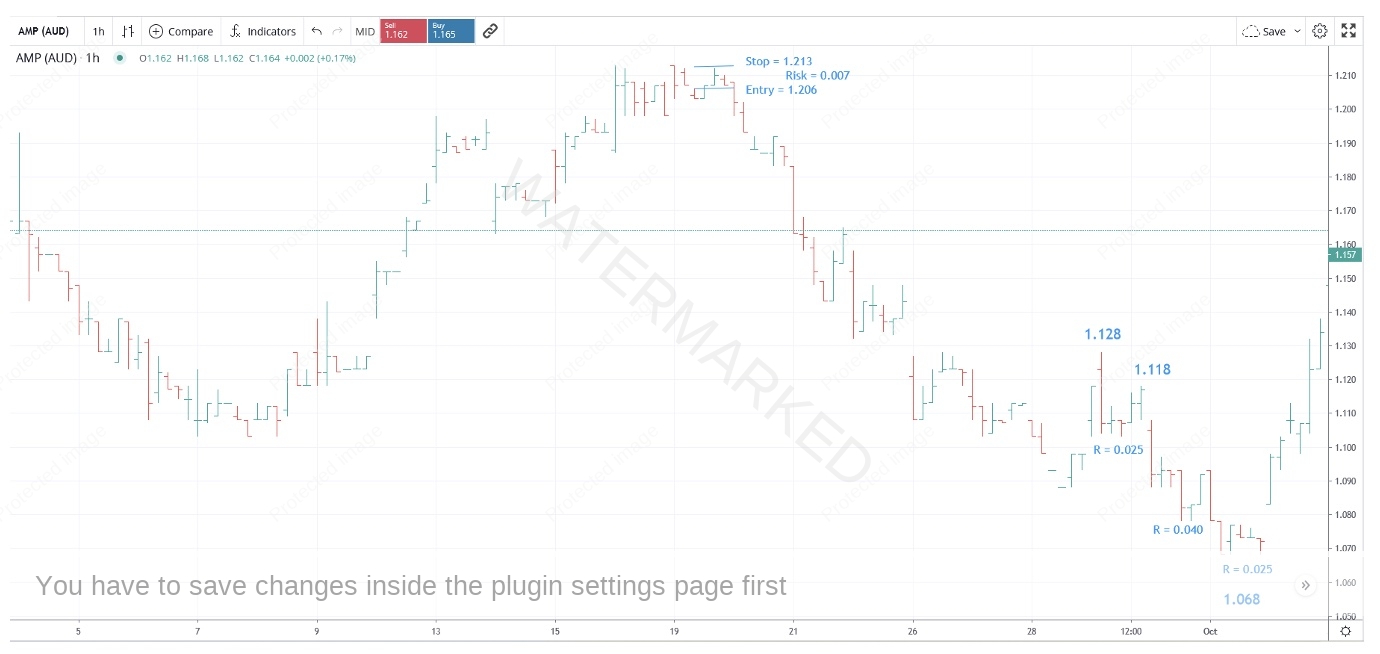
This alone might not always stop the market but if you analyse the hourly chart, it helps to clarify the picture. As you can see below in Chart 4, there was a 1-hour First Range Out of 0.025 points. 200% of this First Range Out running down from the next lower top equals 1.068 exactly (the calculation is: 2 x 0.025 = 0.05. 1.118 – 0.05 = 1.068).
You might also notice that the third hourly swing range into the low was another 0.025 points. Again, signs of completion this daily swing could be over and a trigger to move stops or take profits.
Chart 4 – Daily Swing Breakdown
Since then (at the time of writing) AMP has put in 2 very strong up days and if you had taken profits, then this was a successful trade had you recognised the cluster and closed out your position around the low for a double-digit Reward to Risk Ratio.
The nice thing about locking in profits when a cluster presents, is not having to sit through the pull backs and watch your profits disappear. Knowing that double tops have the ability to do 200% of the range means you could then wait for another setup if one presents. However, you don’t have to try and capture every part of the move, what about just trying to capture the best part of a move?
If you want to add this 200% of the First Range Out combination cluster to your trading plan you might like to think about how you might find these types of trades. What if they came to you?
With a bit of pre-work, maybe they can! You could set alerts in ProfitSource or on your trading platform when a market approaches the 200% milestone. Then you could assess the trade and decide, is it a strong cluster? If so, you could look for a low-risk entry. If it doesn’t line up, let it go for someone else to trade.
Do the hard work at the start then let the trades come to you!
Happy trading,
Gus Hingeley


