Mixed Signals
Stay the Course
It’s hard to believe that we are in October, but if you were reading the stock market almanac you wouldn’t be surprised to see the month of October again presents a month of volatility and uncertainty. After a recent holiday break, I come back to the markets with a sharpened focus but also the feeling that we have seen this all before. Most likely it’s the lived experience of the Nasdaq crash of 2000, the decline into 2003, the GFC debacle and more recently the Covid years. All these events proved challenging for all walks of life, as a trader I feel that as much as things change, they stay the same.
In short, history repeats, the “actors” and storylines change in the market but ultimately the themes of ups and downs and market volatility in cycles stays the same. The best example I could provide is if you removed the time scale of any market that traded 100 years ago and viewed it as a swing or bar chart, then it would look like a current chart of any market that makes the news today. We can change the backdrop, but our skills stay the same.
Currently we all understand that the global economy is volatile and uncertain, inflation, interest rates, supply chain and conflict all make markets unsure of the future. This leads to price action movement and that can vary from bullish to bearish. This is a good time to be a trader, but if we focus on the news and social media feeds there are, more than ever, negative messages that can shift our focus.
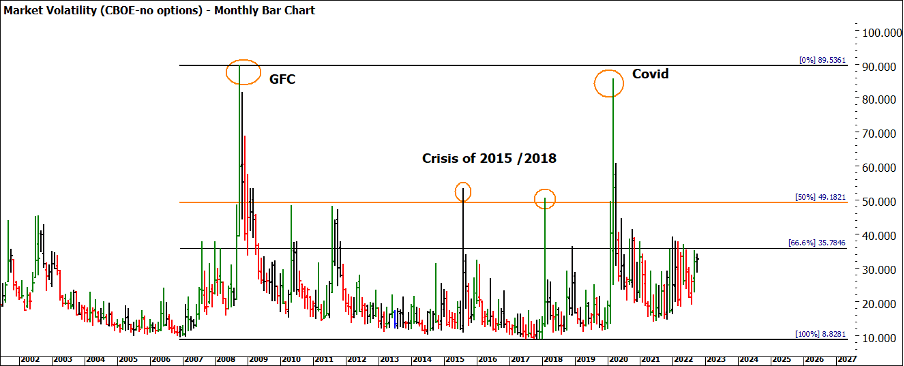
Those who focus on the Armageddon style of market philosophy, and there seems to be plenty out there, see this as some great reset to caveman days ahead. Let’s look at the historical norms of market volatility. In Chart 1 I have referenced the VIX Index from the US, you can trade the price movement, but many just use this as a reference point. The definition from the CBOE is below:
The VIX Index is a calculation designed to produce a measure of constant, 30-day expected volatility of the U.S. stock market, derived from real-time, mid-quote prices of S&P 500® Index (SPX℠) call and put options. On a global basis, it is one of the most recognized measures of volatility — widely reported by financial media and closely followed by a variety of market participants as a daily market indicator
Chart 1 shows the peaks in volatility in 2008 and 2020 around the GFC and Covid, both valid causes for fear and uncertainty. If we look at the current levels, we see they are approximately 1/3 of those extreme levels. Not to say that we won’t see worse to come, but the market is not factoring in just yet a return to panic. I do note the levels in 2015 and 2018 around the 50% level. I don’t recall any great crisis in 2015 or 2018 but there was certainly something that got the market thinking.
Chart 1 – Monthly Bar Chart Vix
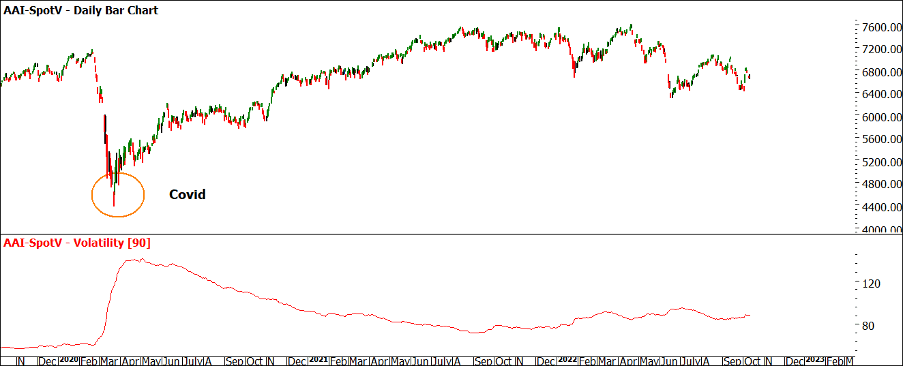
Chart 2 shows us the SPI200 and the volatility indicator, as described below.
The Volatility indicator can be used to confirm trends or changes in direction. Continuing trends will usually display lower levels of volatility, while higher levels of volatility will frequently be encountered around changes in direction.
In raw number terms we have not reached the numbers we saw during Covid, we can assume a steady volatility indictor may suggest a stable trend.
Chart 2 – Daily Bar Chart SPI200
All we ultimately need is a stable trend that we can follow and apply our rules to. With the addition of support and resistance levels layered with price forecasting we can be in the box seat to ride the waves the market is currently producing.
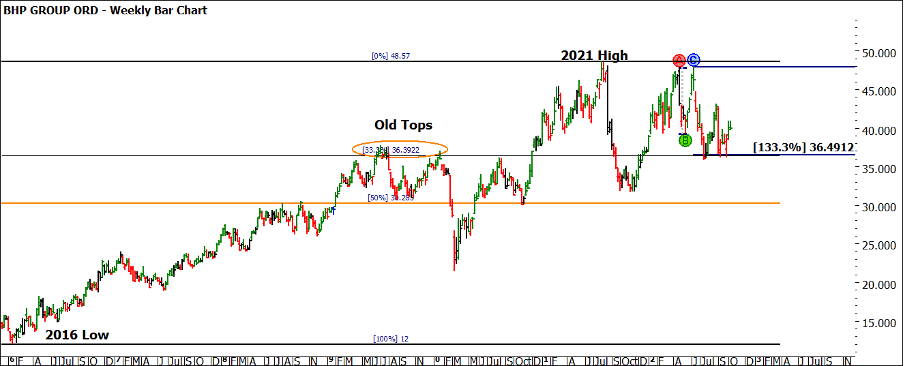
If we return to BHP, the focus of last month, I looked at some price clusters around the $31 level. As I write, the price action is some distance away from that level at approximately $40. This does not mean we are left scratching our heads for setups. Chart 3 shows some key points to consider on BHP.
Chart 3 – Weekly Bar Chart BHP
The three key areas from this chart show us the old tops of 2019/2020 have recently provided some support in the market. They are also supported by the Ranges Resistance Card at approximately 33%, this is using the 2016 low and 2021 highs range and tells us to watch $36.40 as a price level.
If we use the 2022 double tops and project down the 133% level is $36.49.
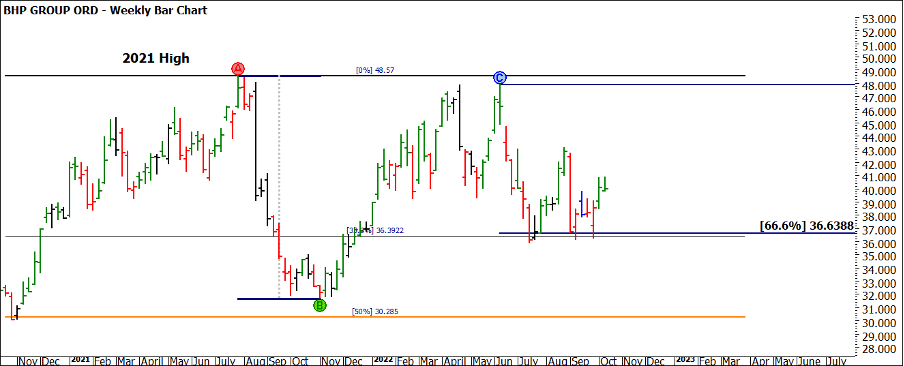
Adding one more range in Chart 4 we can see another cluster for BHP to tackle at $36.64 There are a number of other aspects you can add to this, so I encourage you to review in more detail.
Chart 4 – Weekly Bar Chart BHP
This information provides us a framework to set up a trading plan. If we determine a cluster we can watch and see what the market does as it approaches these levels and if it reacts, changes direction, or accelerates through. We have only seen 3 days closing below $36.51 and never two in a row. If we think $31 is a possibility on BHP, then we first must close consistently below $36.51. I hope you can see that by framing the market in this way we can help to understand what direction we can bias our trades to on a specific market.
If we were to layer some basic time work over the top you can see why with swing charts, price forecasting and some time counts you can build a trading plan with positive expectation. I encourage students of the Ultimate Gann Course to apply their time techniques to this market to add further clarity to the current market action.
It’s important to take away that the recent volatility and market sentiment will make setting and holding positions more challenging. This can be countered by reducing risk via position size and be more aggressive in locking in profits when created.
It’s a good time to be a trader, ignore the noise as we have more than ever. We must adjust to the type of market we are presented with, and this will always be the case. Long or short profits from the market don’t appear any differently in your trading account. I encourage you to study BHP and watch it going forward as I anticipate trades both ways for those prepared.
Good Trading
Aaron Lynch


