Symmetry on the Euro
If you could go back in time, which trade would you take knowing what you know in hindsight?
Would it be the crash of the 2020 tops, the Bitcoin bull market or the recent bear markets on some of the major currency pairs?
Well, fortunately enough, we can go and pick apart any move that ‘has been’ to understand if we could have called that move and traded it.
In recent articles I’ve written about the 200% milestone of ‘a’ First Range Out being the foundation of a trading system and looking for a tight cluster around this major milestone. This month’s case study will continue the same theme and dissect a recent trade setup on the Euro currency pair, or FXEUUS in ProfitSource.
This is a nice example of a 200% First Range Out milestone coming together to give a very tradeable Classic Gann Setup with a high Reward to Risk Ratio trade.
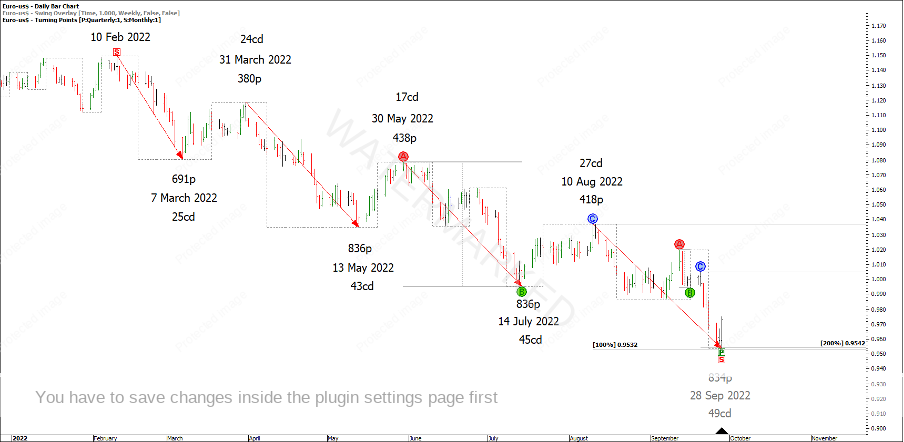
The Euro presents clear weekly sections of the market from the 10 February 2022 monthly swing top. Displayed in Chart 1 below, 200% of the daily First Range Out of the last weekly swing into the 28 September low, clusters with a 100% repeat of weekly section 3.
Chart 1 – Sections of the Market
The last daily swing can be broken down into its own 4-hour swing ranges, and the last 4-hour swing can be broken down into its own 1-hour swing ranges, and of course the last 1-hour swing range can be broken down into its own smaller ranges.
Can you see other swing range milestones and smaller sections of the market that tie in with this cluster? There are more for anyone keen to find them!
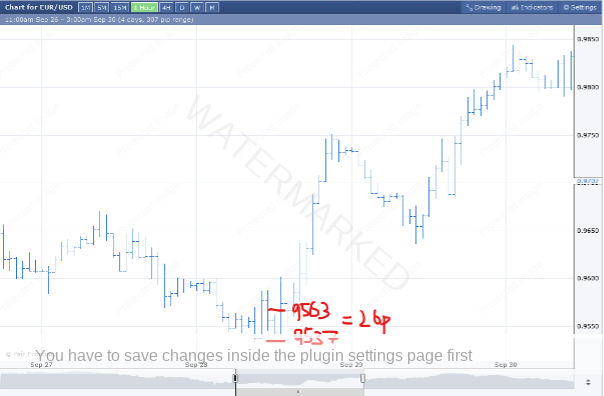
How could you have entered this trade? For this example, I’m going to use a 1-hour first higher swing bottom entry. With an entry at 0.9563 and an initial stop at 0.9537 this trade has a 26 point risk. See Chart 2 below.
Chart 2 – 1 Hour Entry Bar
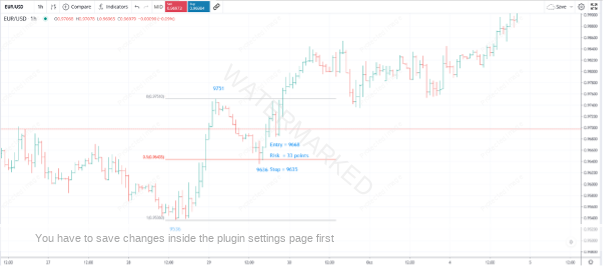
Position one is set with 26 points of risk. The next day a second potential entry presented, this time at the Point C of a 4-hour ABC pattern. Can you see the cluster using the 4-hour and 1-hour ranges?
Chart 3 – 4 Hour First Higher Swing Bottom
If we use the same time frame for entry, although as the 1-hour swing chart turned up, this would have given us a second trade with 33 points of risk.
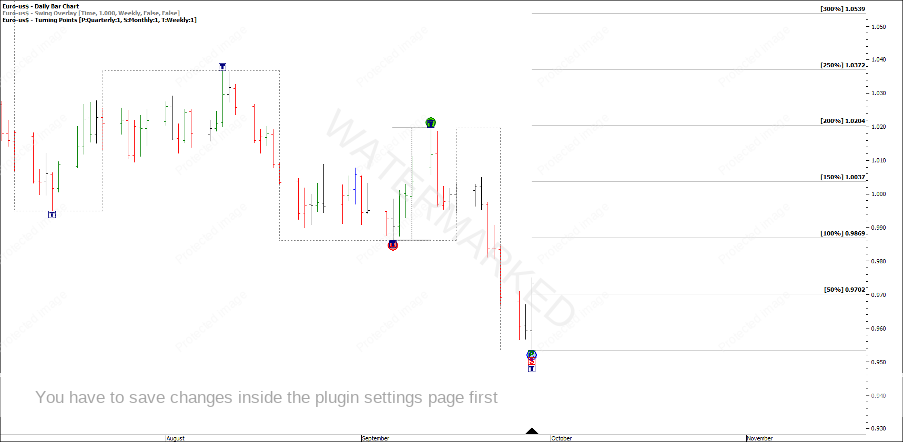
Now where to place our profit target and run a trailing stop? Considering the last daily swing up on the Euro was a small range, I have chosen the last weekly swing up to gauge our short to medium term price forecasting targets.
Chart 4 – Weekly ABC Milestones
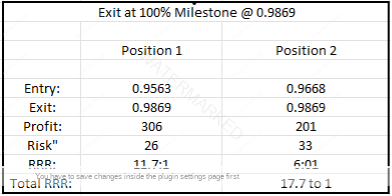
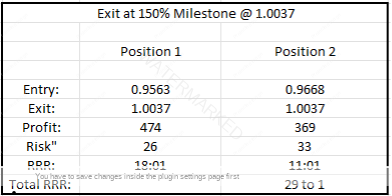
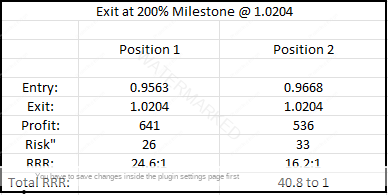
Using the above major milestones as exit targets, I can calculate the potential Reward to Risk Ratio scenarios.
Chart 5 – Exit at 100% Milestone
Chart 6 – Exit at 150% Milestone
Chart 7 – Exit at 200% Milestone
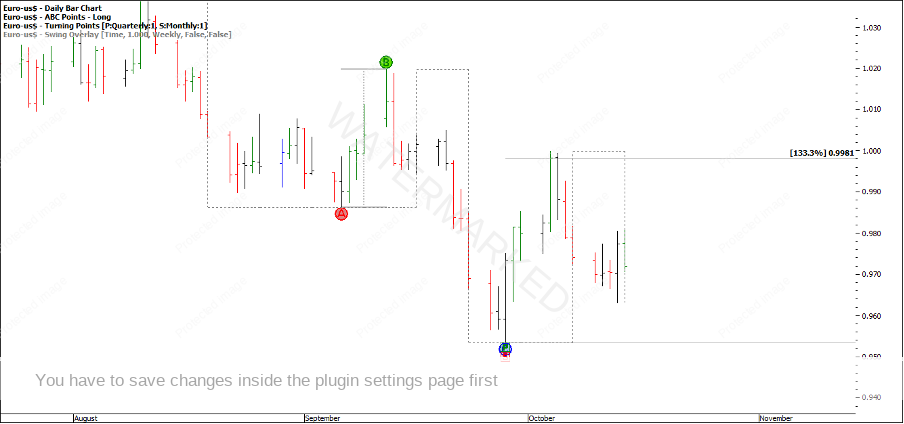
At the time of writing, the weekly swing up is an expanding swing and has pulled back from the 133% milestone.
Chart 8 – Current Market
The question I ask myself now, is the current weekly swing down a retest of the 28 September low or will this be broken and more downside to come? Either way, I’ll be happy to wait until the next high quality, high probability trade presents itself.
Happy trading,
Gus Hingeley
