Bean Oil Intra-day
Recently my monthly articles have focused on setups from the bigger picture. That is, based on analysis and trading plan work using the higher time framed charts, or if you like, using a reference range from the weekly swing chart or above. This month’s article focuses on a quality smaller picture setup, for which a smaller reference range was used. But as you will see by the end of the article, the size of the reward to risk ratio well and truly made up for it.
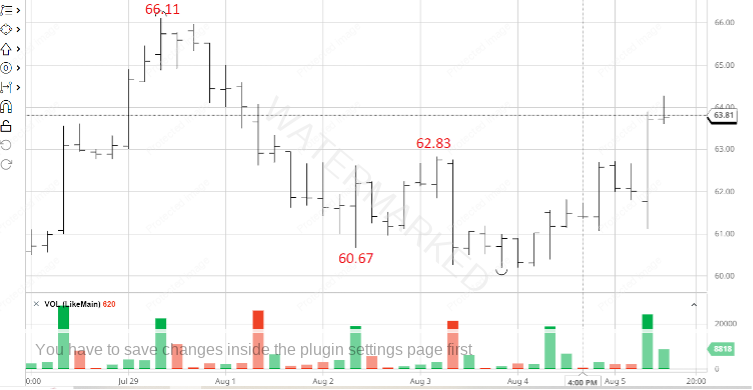
The setup we’ll be looking at occurred in the Soybean Oil futures market in early August of this year. When 4 August 2022 came, three price analysis elements had clustered together at an average of 60.11 US cents per pound. One of those was based on price analysis off the 4 hourly intraday chart. For reference purposes, below is a screenshot of the said chart from barchart.com, with a few key price inputs labelled. But I won’t spoil it entirely! As an exercise, it’s up to you to reproduce the analysis completely and come up with the same price cluster average.
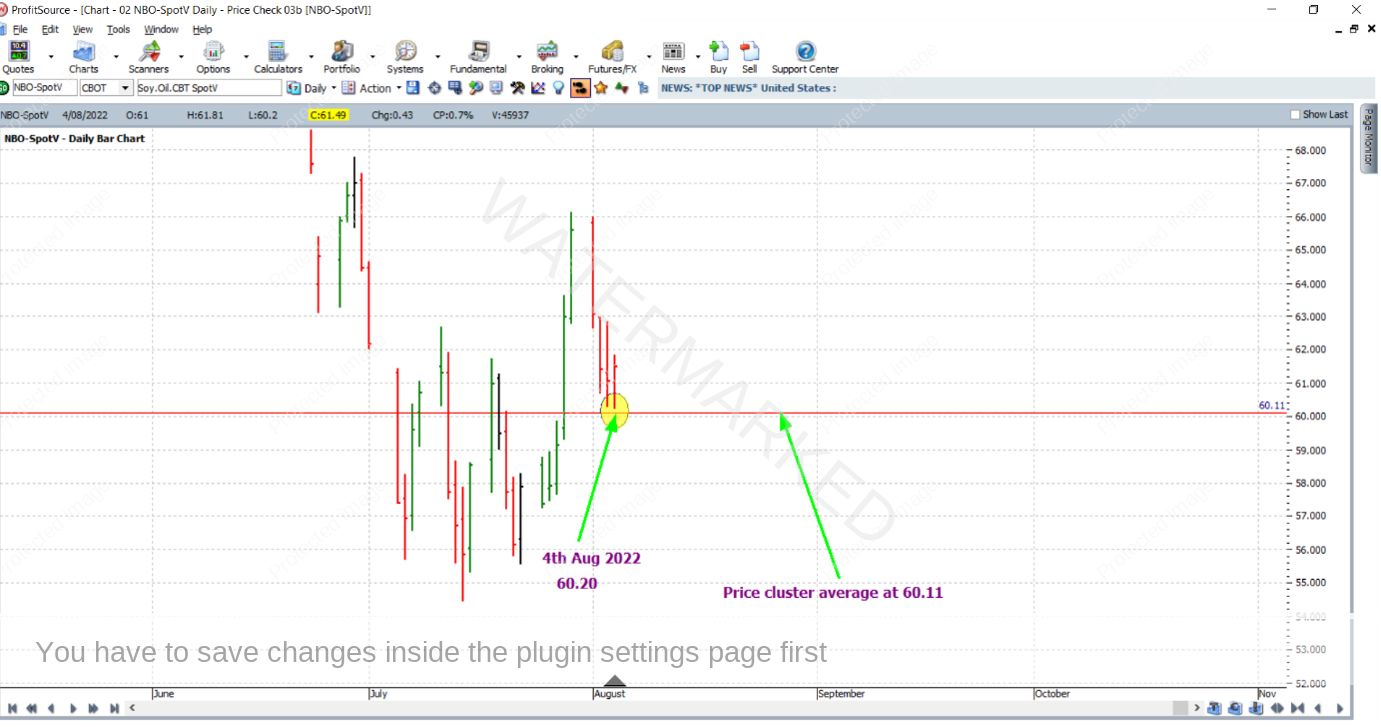
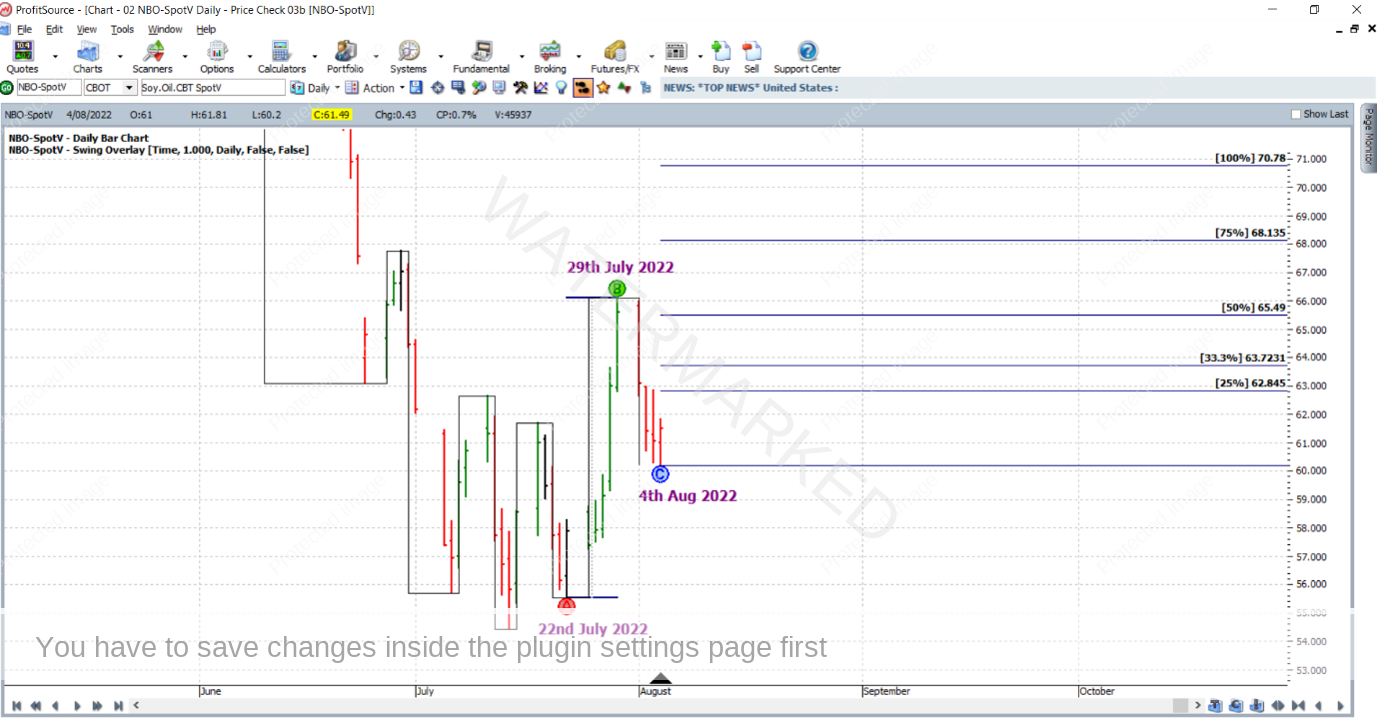
Shown below is the price cluster average and the daily bar chart from ProfitSource, chart symbol NBO-SpotV. The market had lowed at 60.20, 9 points away from the cluster.
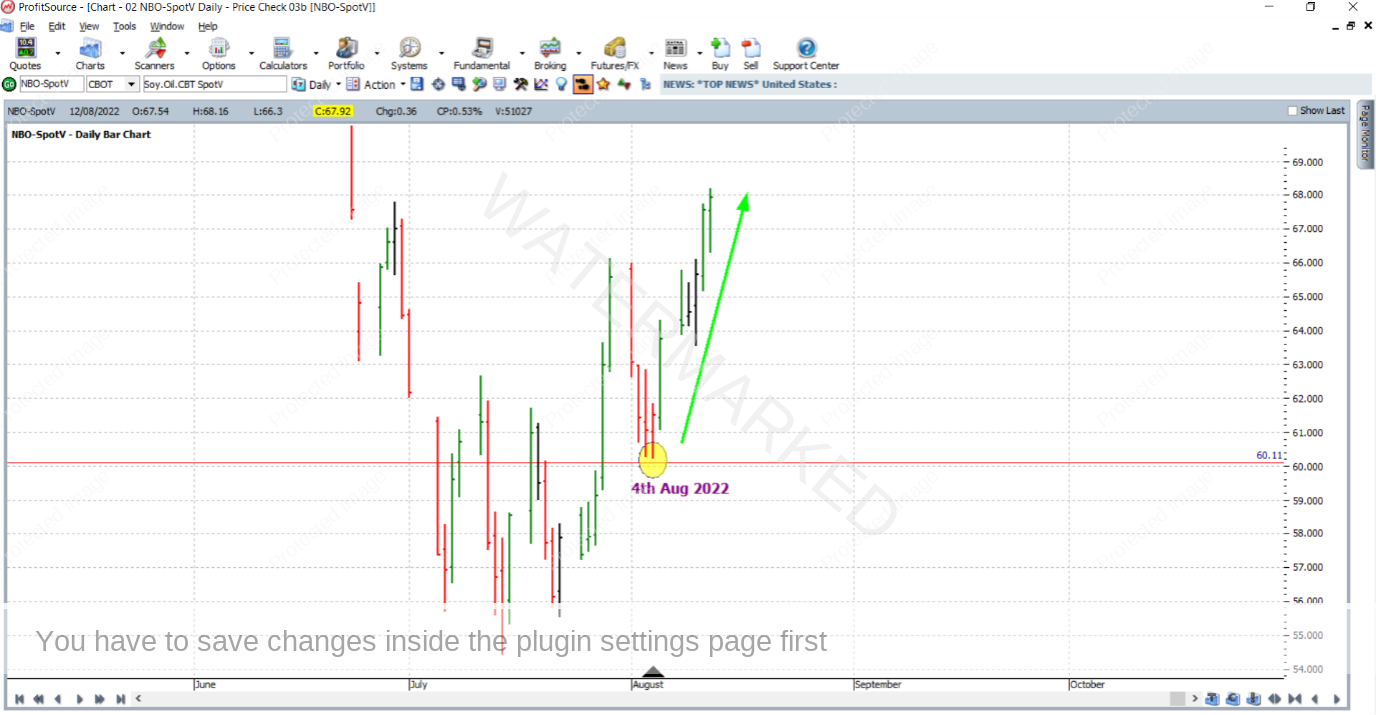
And a nice rally followed:
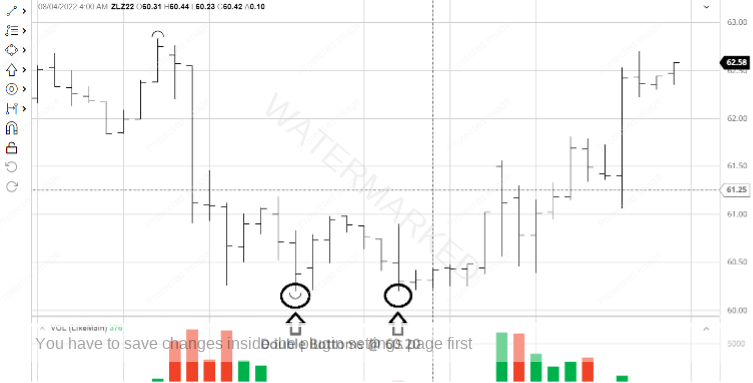
As for an intraday entry signal, this came from the 60 minute bar chart (off the December contract, shown below from barchart.com) in the early morning hours of 4 August 2022 Chicago time. The 4am hourly bar was up, confirming an hourly swing chart low up from two small picture double bottoms both at 60.20; note that this double bottom formation was not one of the three main initial price reasons in the analysis. Because it was a small picture double bottom, it merely added a little further confirmation.
Taking this entry signal would have had you long Bean Oil at 60.43 with an initial exit stop at 60.19.
Now for a reference range and a trading plan. The range chosen was the last daily swing in the same direction of the trade, with Point A at 22 July 2022, Point B at 29 July 2022 and Point C at 4 August 2022. The trade will be managed “Stock Style” as though a usual ABC trade. This is illustrated below in ProfitSource with the aid of the daily swing overlay and ABC Pressure Points tool.
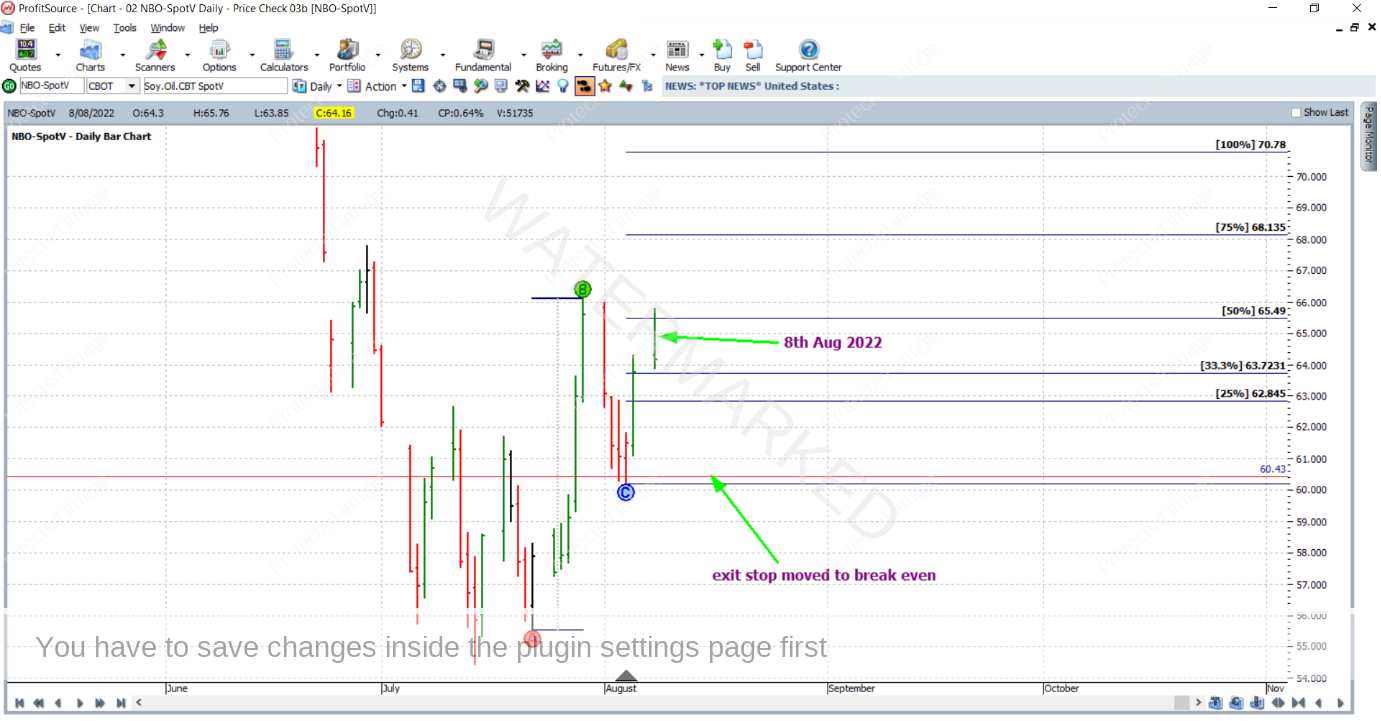
A couple of days later on 8 August 2022, the market reached the 50% milestone and stops were moved to break even. With stops in this position, you can see below how close the intraday entry was to the low itself.
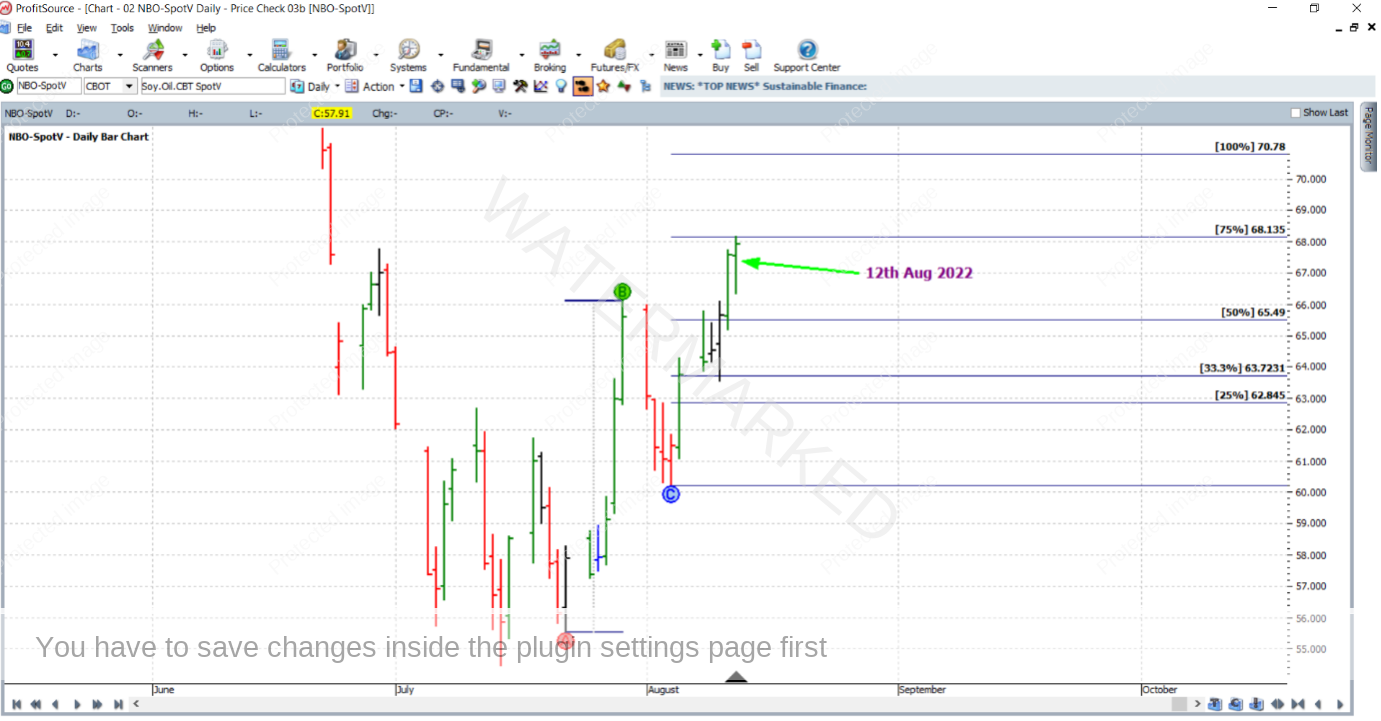
On 12 August 2022, the market reached the 75% milestone, and the trade was closed at a price of 68.13.
Obviously this trade would have been a little “red eyed”. Both analysis and execution drew significantly from the intraday chart of a market in a very different time zone to most of the readers of this article. So were the rewards of doing this worthwhile? Let’s see…
In terms of the Reward to Risk Ratio:
Initial Risk: 60.43 – 60.19 = 0.24 = 24 points (point size is 0.01)
Reward: 68.13 – 60.43 = 7.70 = 770 points
Reward to Risk Ratio = 770/24 = approximately 32 to 1
The contract specifications from the CME group website say that each point of price movement changes the value of one Soybean Oil futures contract by $6USD. Therefore in absolute USD terms the risk and reward for each trade of the contract is determined as:
Risk = $6 x 24 = $144
Reward = $6 x 770 = $4,620
At the time of taking profit, in AUD terms this reward was approximately $6,507.
If 1% of the trading account was risked at entry the gain in account size would be as follows:
32 x 1% = 32%
Work Hard, work smart.
Andrew Baraniak
