Currency Conflicts
The role that currencies play across the globe is critical. In general, currency strength and weakness can be linked back to fundamental roots of economic growth, domestic interest rate settings and international trade needs. These underpin the mechanism for different people, companies and countries around the world needing to access a particular currency for their needs.
The recent volatility in the digital currency space has demonstrated that fiat currency may still have a way to go in terms of its longevity. And whilst blockchain will remain and grow as a concern for the world, the overall mechanism of “trust” can be undone very quickly when enough of the players choose to not trust or believe in the system. This has been seen consistently across history as “new” financial instruments boom and bust and then recycle to the next consultant’s great new idea to make money in financial circles.
We must also accept that currencies can be used as weapons to bring about pressure economically and are as cut and thrust as armed conflict on the battlefield. I can’t help but think we are living in one of those times where history will reflect that currencies were used for more than a means of trade. This extends further than currency, as there is a growing movement of “stackers” who believe commodities like gold and silver will again be used as a method of transaction but that is a whole other discussion.
Last month I looked at the US Dollar index and speed angles to understand the strength of a market. Very much a 3rd dimension tool, we can take the more developed approach with Boxing the Market as David did in the Master Forecasting Course. The current bullish move has been strong and since the last time I wrote, the price action has dropped approximately 8% and this has flow on effects to all other currencies as well as assets that are priced in US dollar like the major commodity markets.
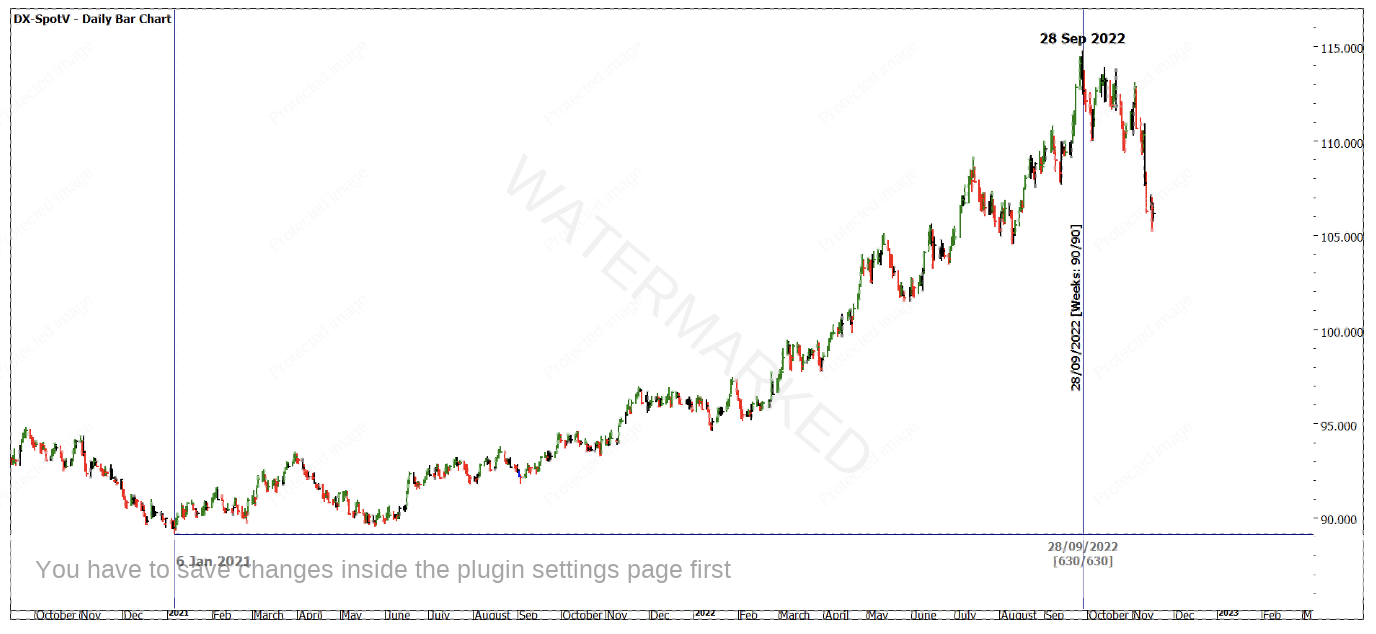
Chart 1 shows the decline, but more importantly the bullish cycle in terms of a time count. The move from the low in 2021 to now was 630 days or exactly 90 weeks. We know key numbers to watch for, but we must keep creative in how we apply them and on what time frames.
You we can also look for percentages and multiples to add to the mix.
Chart 1 – Daily Bar Chart Dx-Spotv
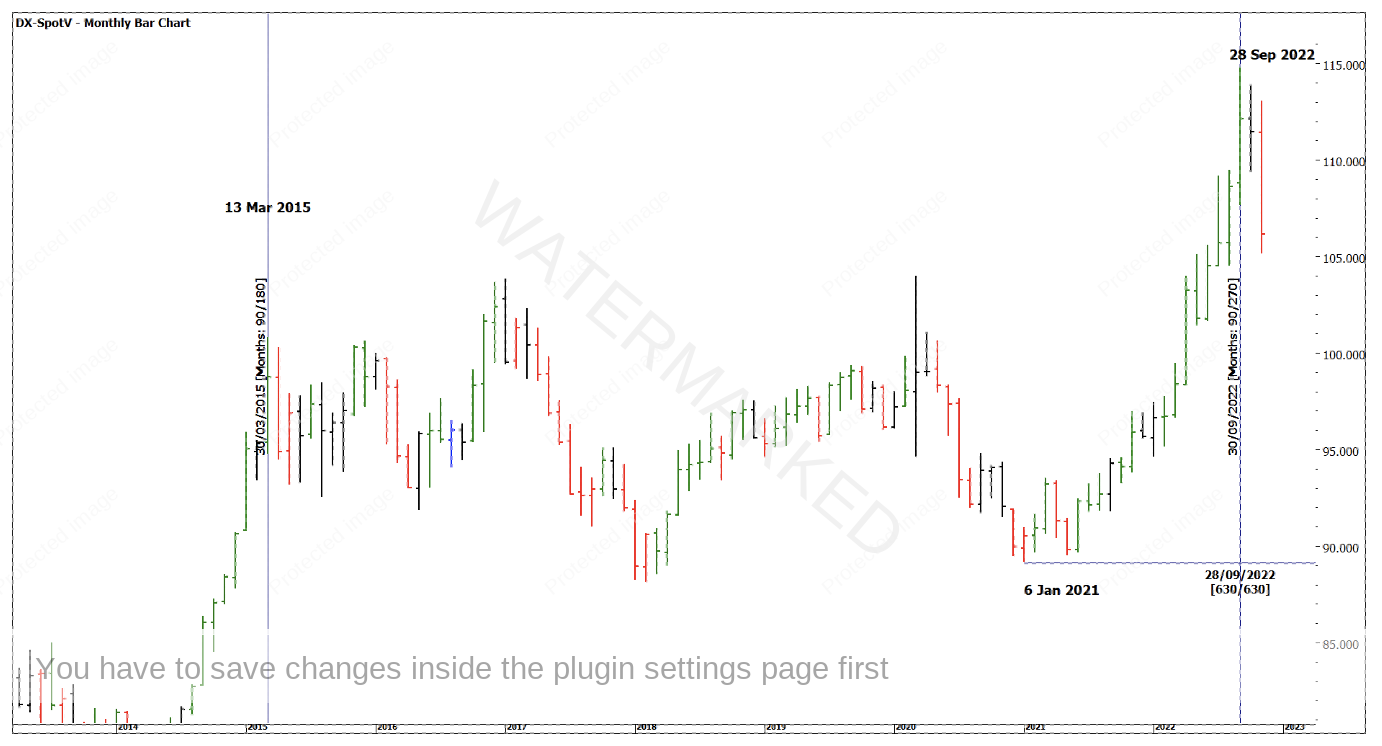
Chart 2 extends the time frames out to look for any harmonies for 90 months. We can see the March 2015 high was a place where the market stopped but not what we would regard as a showstopper on the downside. It would have been more useful to exit long positions at the time.
Chart 2 – Monthly Bar Chart Dx-Spotv
We could apply 90 years if we had enough data to go back that far, as you start to see why Gann said you can look for cycles into the future that included years. By applying this to a smaller time frame we can look to days, degree and even into intra-day time periods.
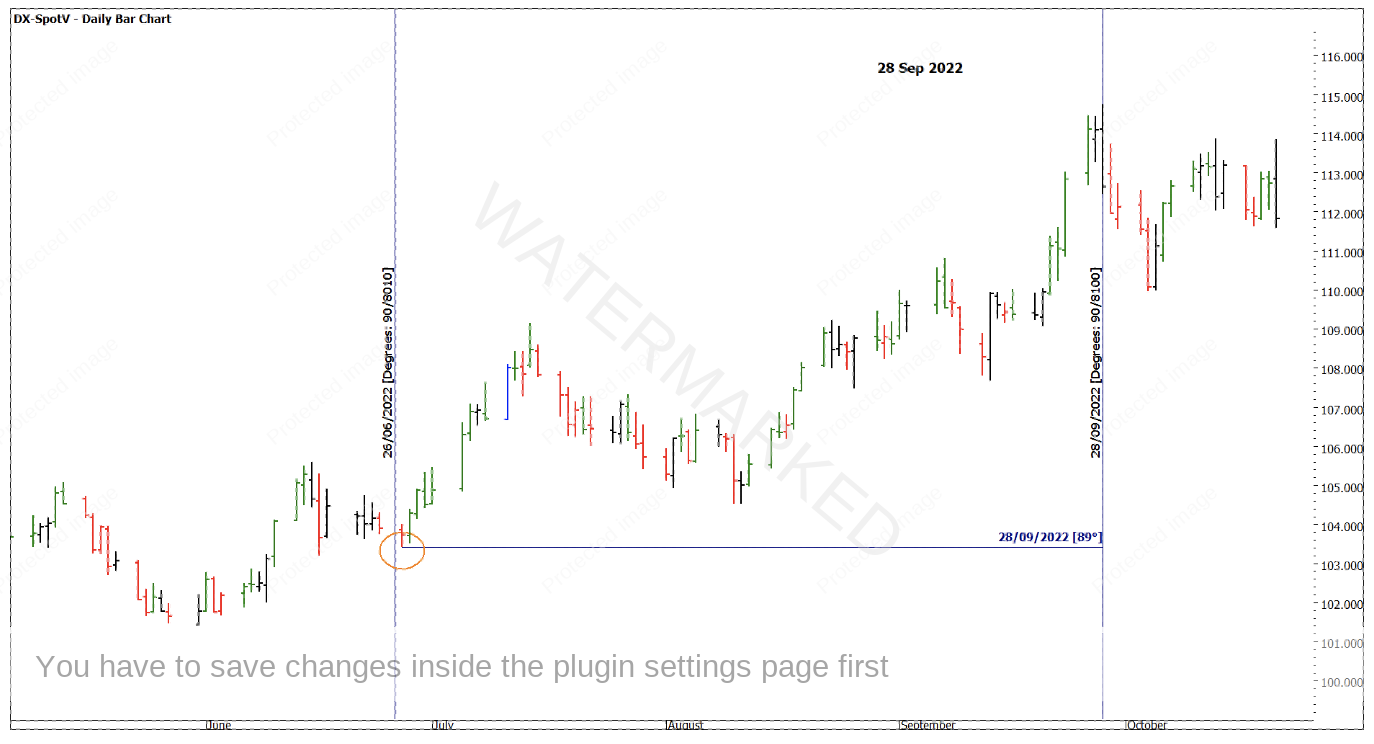
By using trading and calendar days we do not see any consequential harmonies. Chart 3 highlights 89 degrees between turns.
Chart 3 – Daily Bar Chart Dx-Spotv
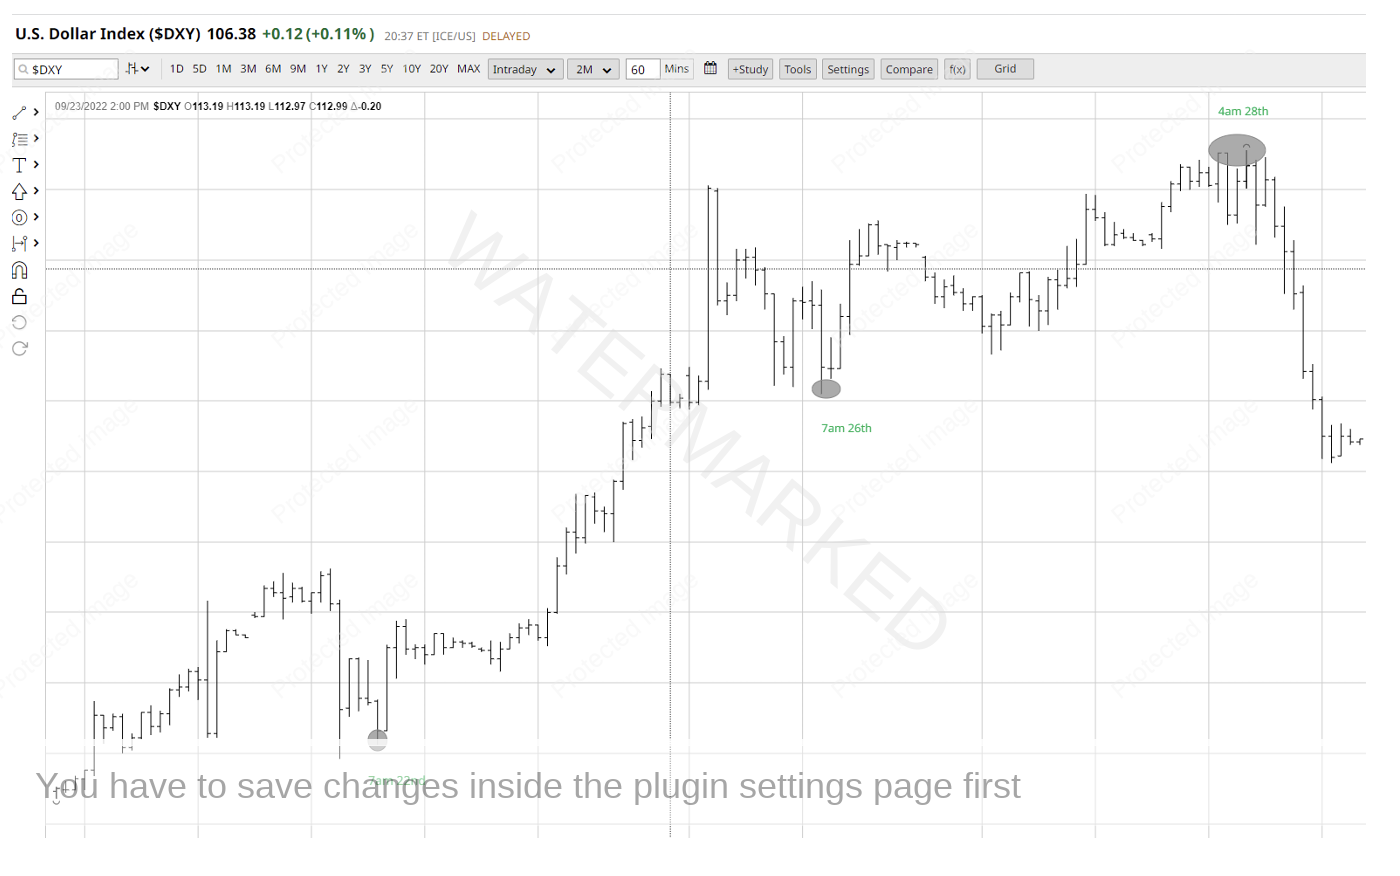
The last two charts show intra-day time frames, Chart 4 shows the hourly bar chart leading into what is the yearly top. Approximately 92 hours before the eventual high the market made a low, the use of 50% of that number also helps as 45 hours prior to the high we saw a turn on the 26th of September.
Chart 4 – Hourly Bar Chart Dx-Spotv
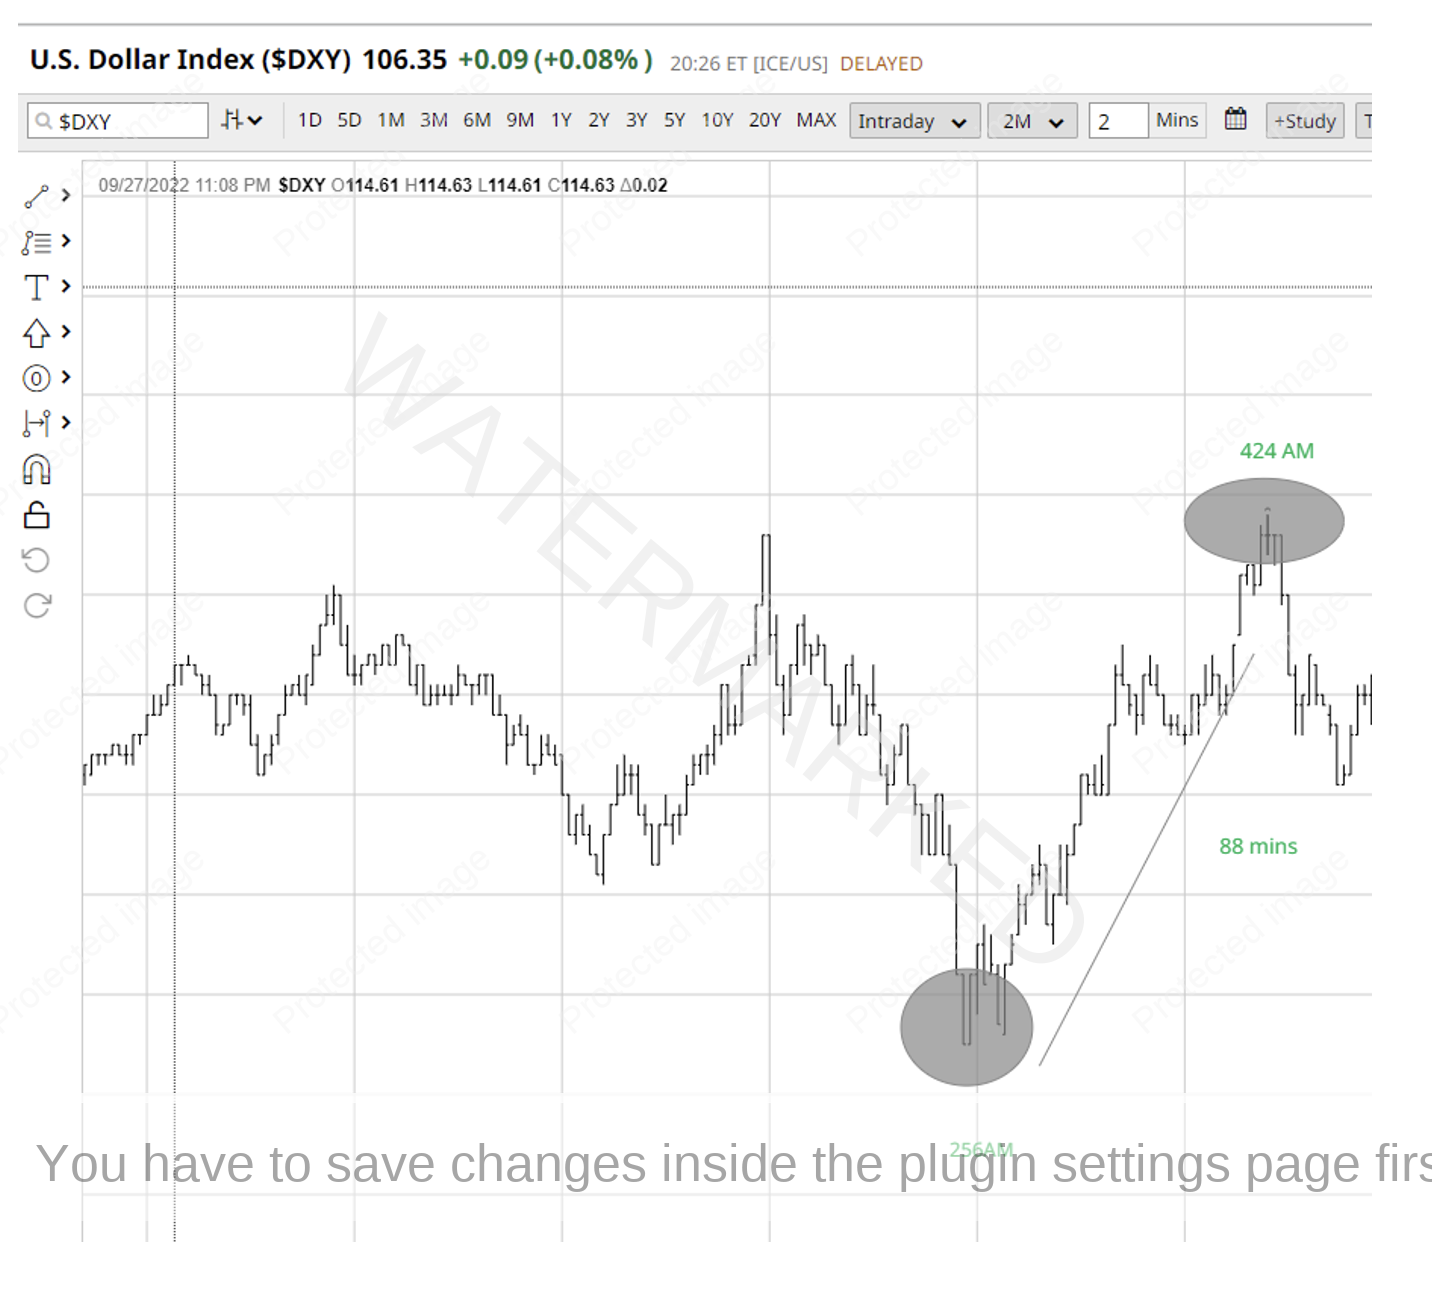
Chart 5 breaks down the picture to close the smallest building blocks, 1 min bars. The final move into the current high was 88 minutes. The trigger for entry on the downside was on the 90th 1 minute bar.
Chart 5 – Hourly Bar Chart Dx-Spotv
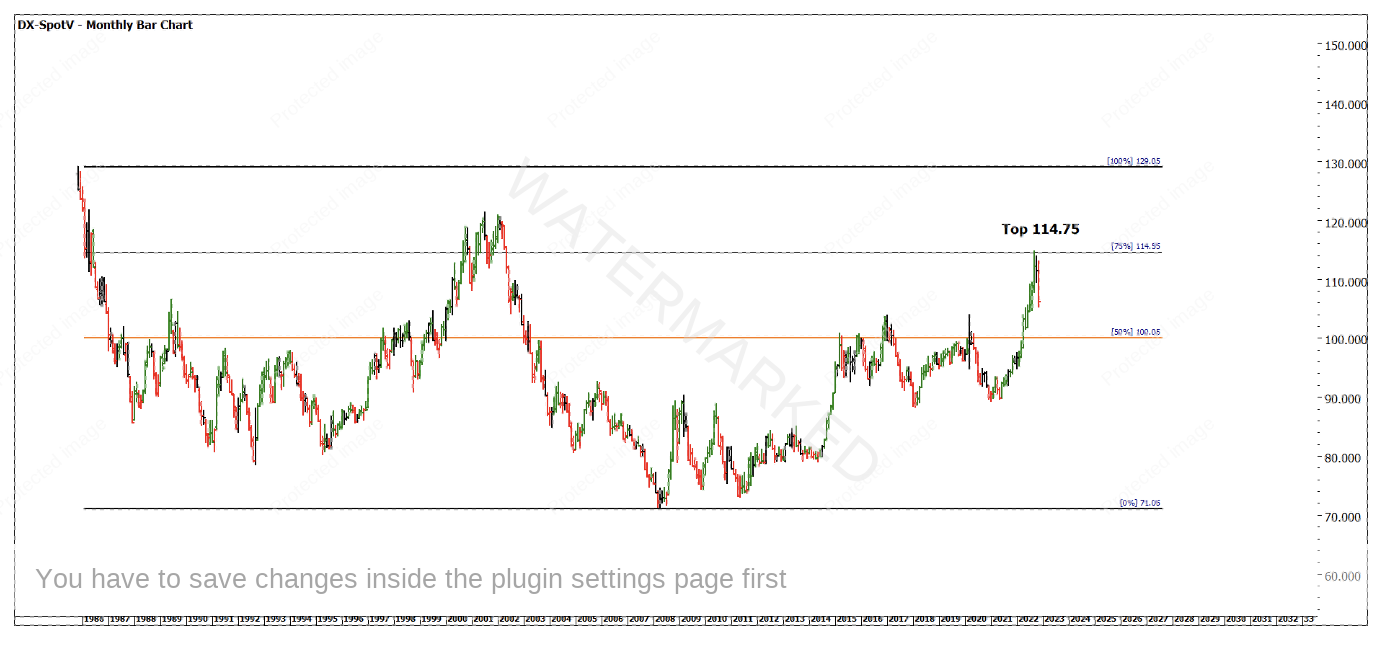
There are several other pieces of analysis that can be bolted on to this setup to create greater confirmation. To add one piece of price we can use the All-Time Range as a Resistance Card. Chart 6 shows 75% of that range is 114.55 the eventual high came in at 114.75.
Chart 6 – Monthly Bar Chart Dx-Spotv
This is a good example for you to work on and even test your entry and trade management strategies to see what the maximum Reward to Risk Ratio could be generated.
Given the importance of the US dollar, this decline in prices lead to a series of other strong moves in currencies. This analysis may have led to other setups on a preferred market.
Good Trading
Aaron Lynch
